
- Home >
- Stock Photos >
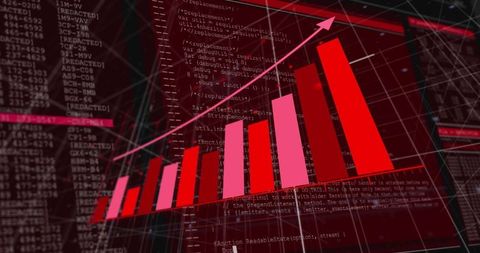
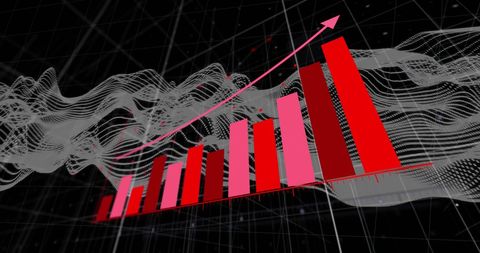
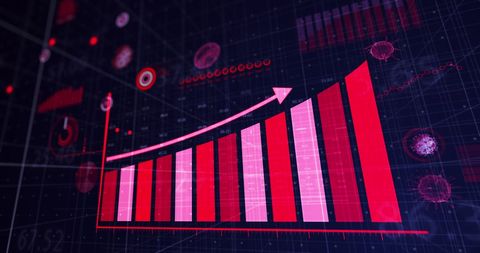
- Futuristic Financial Data Graph with Forward Arrow
Futuristic Financial Data Graph with Forward Arrow Image

Visualizing financial data progression with 3D graph spanning dark-tech calculating grid. Ideal for illustrating global business trends, statistical analysis in presentations, or executed data processes on financial applications. Authentic display of technological advancement suited for blogs or tech-oriented topics.
Powered by 


downloads
Tags:
More
Credit Photo
If you would like to credit the Photo, here are some ways you can do so
Text Link
photo Link
<span class="text-link">
<span>
<a target="_blank" href=https://pikwizard.com/photo/futuristic-financial-data-graph-with-forward-arrow/00e9cfdbaabe19345cc2b68096ac37e6/>PikWizard</a>
</span>
</span>
<span class="image-link">
<span
style="margin: 0 0 20px 0; display: inline-block; vertical-align: middle; width: 100%;"
>
<a
target="_blank"
href="https://pikwizard.com/photo/futuristic-financial-data-graph-with-forward-arrow/00e9cfdbaabe19345cc2b68096ac37e6/"
style="text-decoration: none; font-size: 10px; margin: 0;"
>
<img src="https://pikwizard.com/pw/medium/00e9cfdbaabe19345cc2b68096ac37e6.jpg" style="margin: 0; width: 100%;" alt="" />
<p style="font-size: 12px; margin: 0;">PikWizard</p>
</a>
</span>
</span>
Free (free of charge)
Free for personal and commercial use.
Author: People Creations
Similar Free Stock Images

Premium


Premium


Premium

Premium


Premium


Premium


Premium

Premium


Premium


Premium


Premium

Premium


Premium


Premium


Premium


Premium


Premium


Premium


Premium


Premium


Premium


Premium


Premium


Premium


Premium


Explore More Free Stock Images