
- Home >
- Stock Photos >
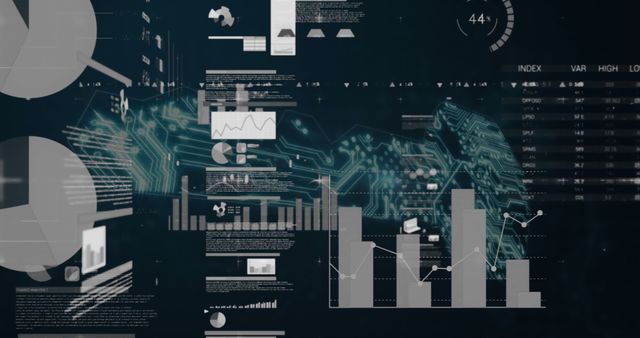
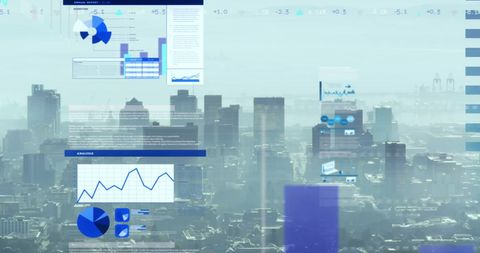
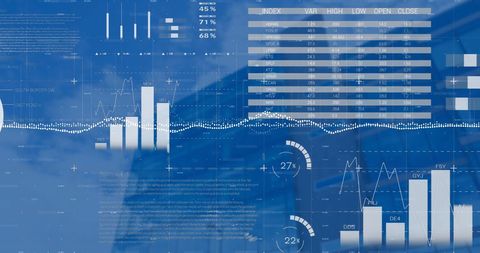
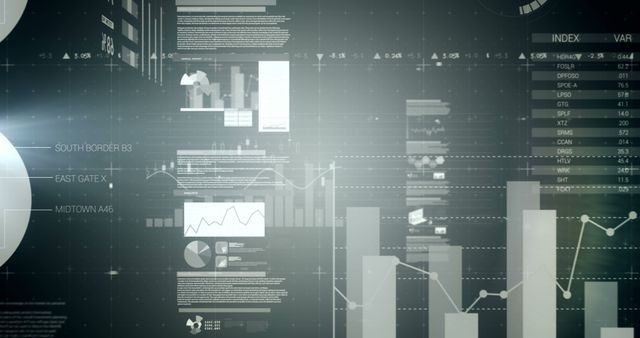
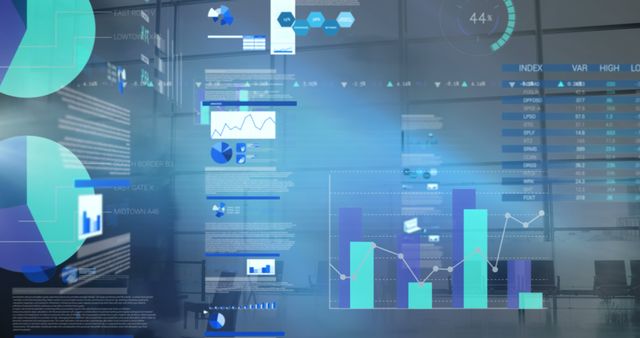
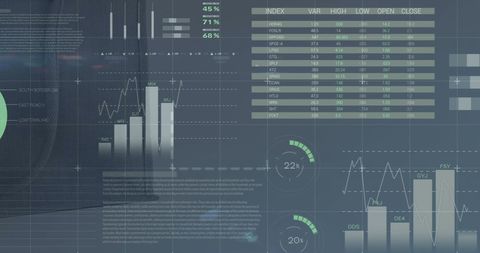
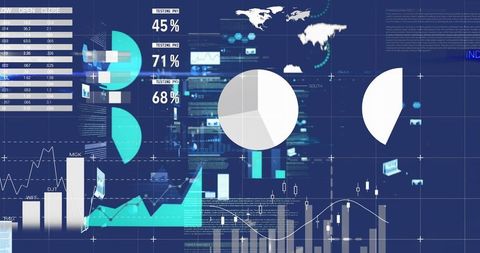
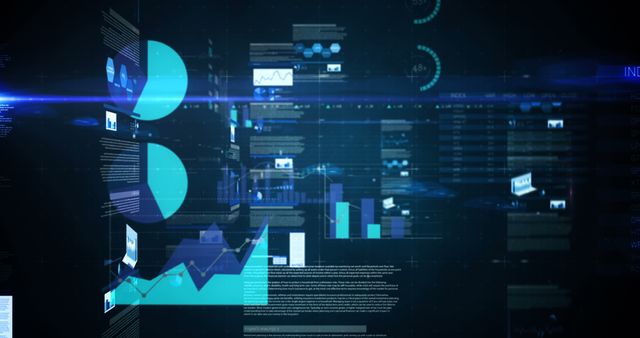
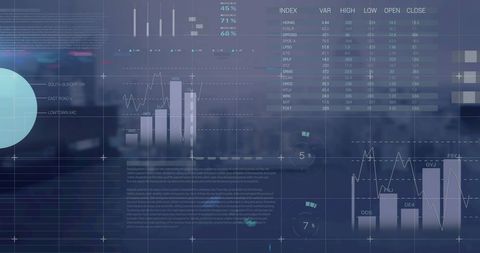
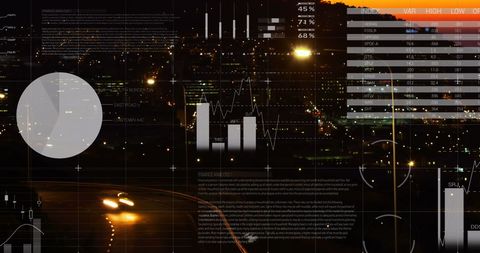
- Futuristic Financial Data Interface with Digital Charts
Futuristic Financial Data Interface with Digital Charts Image
This image showcases a high-tech interface filled with various charts and graphs for financial data analysis. Elements like pie charts and bar graphs bring focus to data trends depicted on this digital front. It exudes a sense of advanced analytics and innovative financial tech applications. Ideal for use in sectors dealing with finance, investment infographics, or presentations on technological impacts on finance industries.
Powered by 


downloads
Tags:
More
Credit Photo
If you would like to credit the Photo, here are some ways you can do so
Text Link
photo Link
<span class="text-link">
<span>
<a target="_blank" href=https://pikwizard.com/photo/futuristic-financial-data-interface-with-digital-charts/e49dcd6fddd56d03fda7070589f1af37/>PikWizard</a>
</span>
</span>
<span class="image-link">
<span
style="margin: 0 0 20px 0; display: inline-block; vertical-align: middle; width: 100%;"
>
<a
target="_blank"
href="https://pikwizard.com/photo/futuristic-financial-data-interface-with-digital-charts/e49dcd6fddd56d03fda7070589f1af37/"
style="text-decoration: none; font-size: 10px; margin: 0;"
>
<img src="https://pikwizard.com/pw/medium/e49dcd6fddd56d03fda7070589f1af37.jpg" style="margin: 0; width: 100%;" alt="" />
<p style="font-size: 12px; margin: 0;">PikWizard</p>
</a>
</span>
</span>
Free (free of charge)
Free for personal and commercial use.
Author: People Creations
Similar Free Stock Images

Premium


Premium

Premium

Premium


Premium


Premium

Premium

Premium


Premium


Premium


Premium


Premium


Premium
Premium

Premium


Premium


Premium


Premium


Premium

Premium

Premium

Premium


Premium


Premium

Premium

Explore More Free Stock Images