- Home >
- Stock Photos >
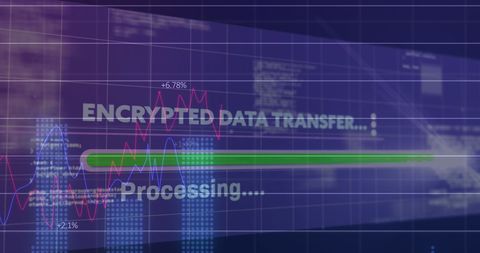
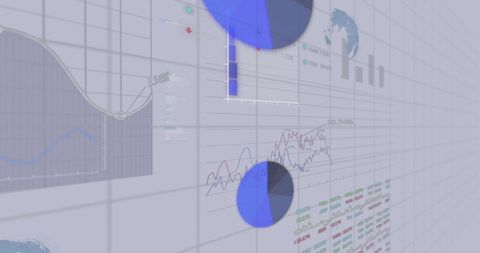
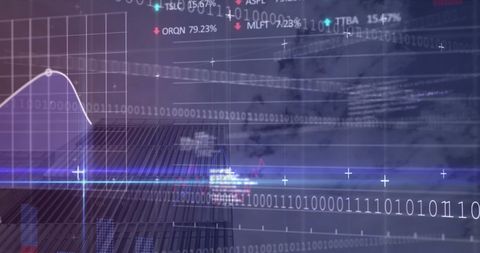
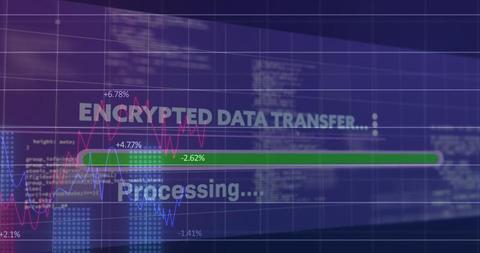
- Futuristic Financial Data Interface with Graphs and Binary Code
Futuristic Financial Data Interface with Graphs and Binary Code Image

Visualizing complex financial data through digital graphics and binary code, this detailed representation of market trends combines modern computing with economics. Great for financial presentations, investment reports, and analytics applications, it reflects advanced technology in data processing and visualization.

downloads
Tags:
More
Credit Photo
If you would like to credit the Photo, here are some ways you can do so
Text Link
photo Link
<span class="text-link">
<span>
<a target="_blank" href=https://pikwizard.com/photo/futuristic-financial-data-interface-with-graphs-and-binary-code/54c61dd4cacb44dbe7add5ec9d8db1ac/>PikWizard</a>
</span>
</span>
<span class="image-link">
<span
style="margin: 0 0 20px 0; display: inline-block; vertical-align: middle; width: 100%;"
>
<a
target="_blank"
href="https://pikwizard.com/photo/futuristic-financial-data-interface-with-graphs-and-binary-code/54c61dd4cacb44dbe7add5ec9d8db1ac/"
style="text-decoration: none; font-size: 10px; margin: 0;"
>
<img src="https://pikwizard.com/pw/medium/54c61dd4cacb44dbe7add5ec9d8db1ac.jpg" style="margin: 0; width: 100%;" alt="" />
<p style="font-size: 12px; margin: 0;">PikWizard</p>
</a>
</span>
</span>
Free (free of charge)
Free for personal and commercial use.
Author: People Creations