
- Home >
- Stock Photos >
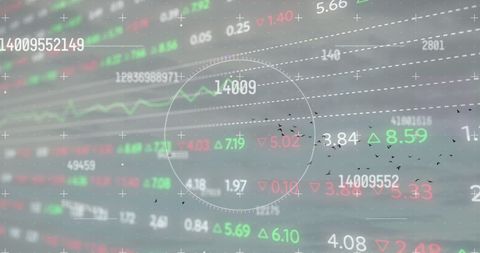
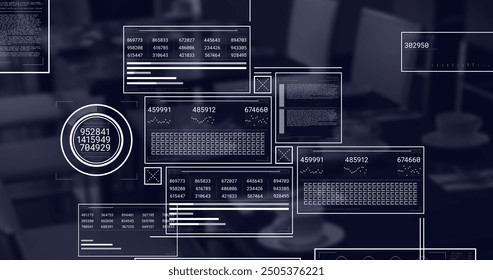
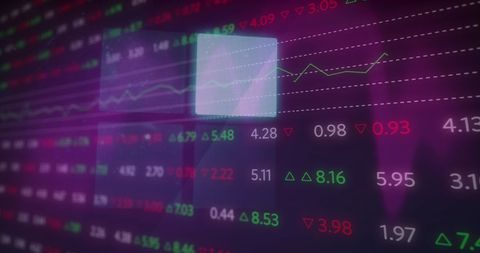
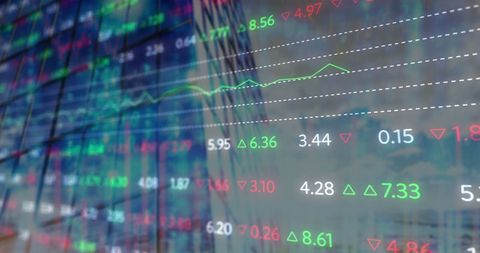
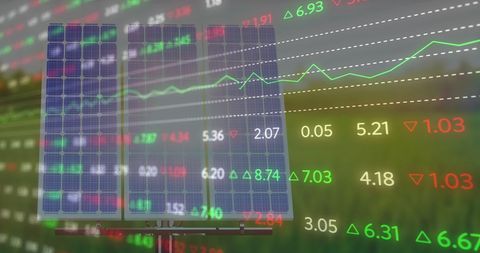
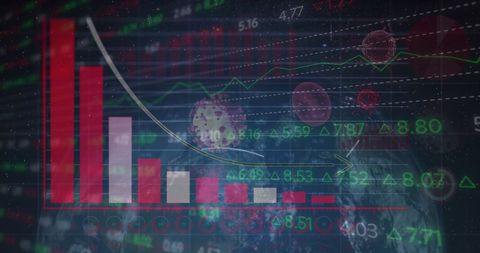
- Futuristic Financial Data Processing in Digital Interface
Futuristic Financial Data Processing in Digital Interface Image
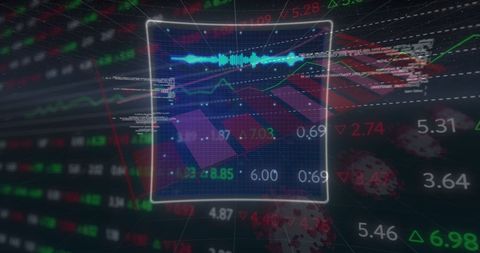
Illustrates advanced data processing on a digital screen layered with financial data and analytics. Perfect for use in presentations or articles about modern finance technology, data security, stock market analytics, or futuristic digital communication techniques.
Powered by  - Get 15% off with code: PIKWIZARD15


downloads
Tags:
More
Credit Photo
If you would like to credit the Photo, here are some ways you can do so
Text Link
photo Link
<span class="text-link">
<span>
<a target="_blank" href=https://pikwizard.com/photo/futuristic-financial-data-processing-in-digital-interface/fb18de1426c6a8f9959316a53a588121/>PikWizard</a>
</span>
</span>
<span class="image-link">
<span
style="margin: 0 0 20px 0; display: inline-block; vertical-align: middle; width: 100%;"
>
<a
target="_blank"
href="https://pikwizard.com/photo/futuristic-financial-data-processing-in-digital-interface/fb18de1426c6a8f9959316a53a588121/"
style="text-decoration: none; font-size: 10px; margin: 0;"
>
<img src="https://pikwizard.com/pw/medium/fb18de1426c6a8f9959316a53a588121.jpg" style="margin: 0; width: 100%;" alt="" />
<p style="font-size: 12px; margin: 0;">PikWizard</p>
</a>
</span>
</span>
Free (free of charge)
Free for personal and commercial use.
Author: Creative Art
Similar Free Stock Images

Premium

Premium


Premium


Premium


Premium


Premium


Premium

Premium

Premium


Premium


Premium


Premium


Premium


Premium


Premium


Premium


Premium


Premium


Premium


Premium


Premium


Premium


Premium


Premium


Premium

Explore More Free Stock Images