
- Home >
- Stock Photos >
- Futuristic Financial Data Visualization and Analysis Interfaces
Futuristic Financial Data Visualization and Analysis Interfaces Image
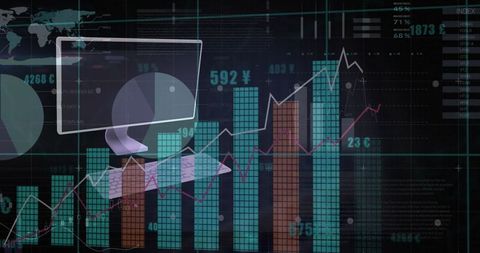
Image depicts advanced financial data visualization. Monitor is projected over dashboards with bar charts and line graphs, symbolizing integration of technology with finance for real-time analytics. World map and currency symbols indicate global financial operations and currency exchange. Suitable for illustrations on fintech innovations, business intelligence solutions, and digital analytics in investment industries.
Powered by 


downloads
Tags:
More
Credit Photo
If you would like to credit the Photo, here are some ways you can do so
Text Link
photo Link
<span class="text-link">
<span>
<a target="_blank" href=https://pikwizard.com/photo/futuristic-financial-data-visualization-and-analysis-interfaces/ac8016dfc063a17989357e47e25f380b/>PikWizard</a>
</span>
</span>
<span class="image-link">
<span
style="margin: 0 0 20px 0; display: inline-block; vertical-align: middle; width: 100%;"
>
<a
target="_blank"
href="https://pikwizard.com/photo/futuristic-financial-data-visualization-and-analysis-interfaces/ac8016dfc063a17989357e47e25f380b/"
style="text-decoration: none; font-size: 10px; margin: 0;"
>
<img src="https://pikwizard.com/pw/medium/ac8016dfc063a17989357e47e25f380b.jpg" style="margin: 0; width: 100%;" alt="" />
<p style="font-size: 12px; margin: 0;">PikWizard</p>
</a>
</span>
</span>
Free (free of charge)
Free for personal and commercial use.
Author: Awesome Content