
- Home >
- Stock Photos >
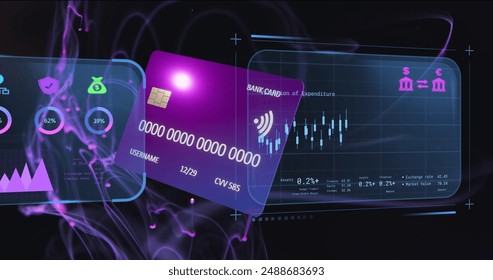
- Futuristic Financial Data Visualization on Digital Interface
Futuristic Financial Data Visualization on Digital Interface Image

This futuristic digital interface showcases dynamic financial data visualization, highlighting patterns and analytics useful for interpreting financial trends. Ideal for presentations on global business strategies, technology integration in finance, or educational materials related to modern data processing techniques.
Powered by  - Get 15% off with code: PIKWIZARD15


downloads
Tags:
More
Credit Photo
If you would like to credit the Photo, here are some ways you can do so
Text Link
photo Link
<span class="text-link">
<span>
<a target="_blank" href=https://pikwizard.com/photo/futuristic-financial-data-visualization-on-digital-interface/6bc48af5eb69b957f55a7e793bedf5ac/>PikWizard</a>
</span>
</span>
<span class="image-link">
<span
style="margin: 0 0 20px 0; display: inline-block; vertical-align: middle; width: 100%;"
>
<a
target="_blank"
href="https://pikwizard.com/photo/futuristic-financial-data-visualization-on-digital-interface/6bc48af5eb69b957f55a7e793bedf5ac/"
style="text-decoration: none; font-size: 10px; margin: 0;"
>
<img src="https://pikwizard.com/pw/medium/6bc48af5eb69b957f55a7e793bedf5ac.jpg" style="margin: 0; width: 100%;" alt="" />
<p style="font-size: 12px; margin: 0;">PikWizard</p>
</a>
</span>
</span>
Free (free of charge)
Free for personal and commercial use.
Author: Authentic Images
Similar Free Stock Images

Premium


Premium


Premium


Premium


Premium


Premium


Premium

Premium


Premium


Premium

Premium


Premium


Premium


Premium


Premium


Premium


Premium


Premium


Premium


Premium

Premium


Premium


Premium


Premium


Premium


Explore More Free Stock Images