
- Home >
- Stock Photos >
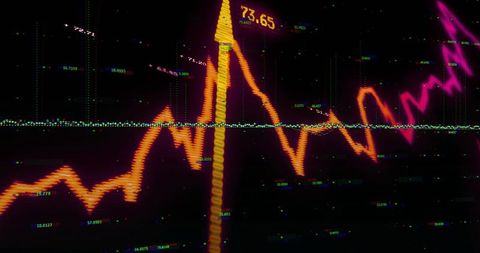
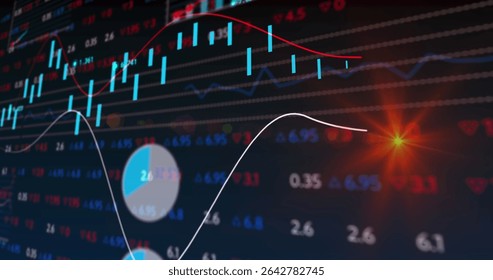
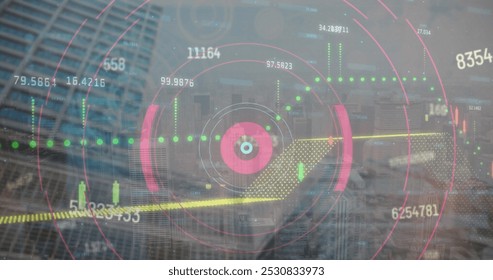
- Futuristic Financial Data Visualization with Circular Graph
Futuristic Financial Data Visualization with Circular Graph Image

Vibrant digital graphic portrays futuristic data analysis through circular scope visuals intertwined with financial data points and numerical insights. Ideal for illustrating digital finance, stock market analytics, and the intersection of technology and business. Useful in presentations, websites, or educational content focused on economic trends or modern tech solutions.
Powered by  - Get 15% off with code: PIKWIZARD15


downloads
Tags:
More
Credit Photo
If you would like to credit the Photo, here are some ways you can do so
Text Link
photo Link
<span class="text-link">
<span>
<a target="_blank" href=https://pikwizard.com/photo/futuristic-financial-data-visualization-with-circular-graph/36ae578c658c69a03f9af65020ed8daf/>PikWizard</a>
</span>
</span>
<span class="image-link">
<span
style="margin: 0 0 20px 0; display: inline-block; vertical-align: middle; width: 100%;"
>
<a
target="_blank"
href="https://pikwizard.com/photo/futuristic-financial-data-visualization-with-circular-graph/36ae578c658c69a03f9af65020ed8daf/"
style="text-decoration: none; font-size: 10px; margin: 0;"
>
<img src="https://pikwizard.com/pw/medium/36ae578c658c69a03f9af65020ed8daf.jpg" style="margin: 0; width: 100%;" alt="" />
<p style="font-size: 12px; margin: 0;">PikWizard</p>
</a>
</span>
</span>
Free (free of charge)
Free for personal and commercial use.
Author: Authentic Images
Similar Free Stock Images

Premium


Premium

Premium


Premium


Premium


Premium

Premium


Premium


Premium


Premium


Premium


Premium


Premium


Premium


Premium


Premium


Premium


Premium

Premium

Premium


Premium

Premium


Premium


Premium


Premium


Explore More Free Stock Images