
- Home >
- Stock Photos >
- Futuristic Financial Data Visualization with Large Letter A
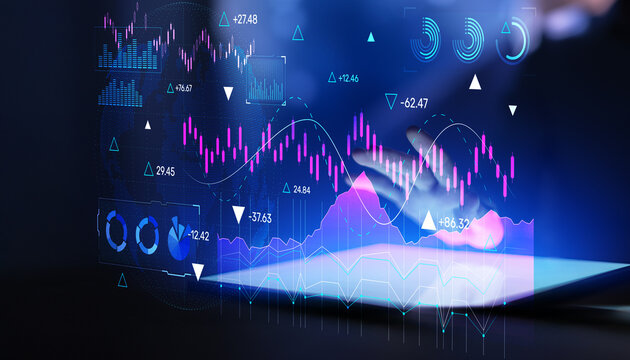
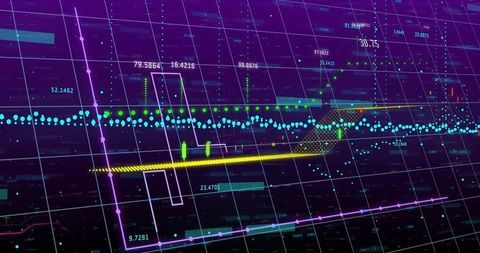
Futuristic Financial Data Visualization with Large Letter A Image

Image shows a dynamic display of financial data featuring a large digital letter 'A', candlestick bars, and indicators such as a +6.02% marker. Suitable for illustrating concepts in finance, stock analysis, data-driven technology, investment opportunities, and market trends. Ideal for use in financial reports, investment presentations, technological finance solutions, or educational material about digital trading environments.
Powered by 


downloads
Tags:
More
Credit Photo
If you would like to credit the Photo, here are some ways you can do so
Text Link
photo Link
<span class="text-link">
<span>
<a target="_blank" href=https://pikwizard.com/photo/futuristic-financial-data-visualization-with-large-letter-a/33b101a774bd20fdf8401aae22ffa878/>PikWizard</a>
</span>
</span>
<span class="image-link">
<span
style="margin: 0 0 20px 0; display: inline-block; vertical-align: middle; width: 100%;"
>
<a
target="_blank"
href="https://pikwizard.com/photo/futuristic-financial-data-visualization-with-large-letter-a/33b101a774bd20fdf8401aae22ffa878/"
style="text-decoration: none; font-size: 10px; margin: 0;"
>
<img src="https://pikwizard.com/pw/medium/33b101a774bd20fdf8401aae22ffa878.jpg" style="margin: 0; width: 100%;" alt="" />
<p style="font-size: 12px; margin: 0;">PikWizard</p>
</a>
</span>
</span>
Free (free of charge)
Free for personal and commercial use.
Author: Awesome Content
Similar Free Stock Images

Premium


Premium


Premium


Premium


Premium


Premium


Premium


Premium


Premium


Premium


Premium

Premium


Premium


Premium


Premium

Premium


Premium


Premium


Premium


Premium

Premium

Premium


Premium


Premium

Premium


Explore More Free Stock Images