
- Home >
- Stock Photos >
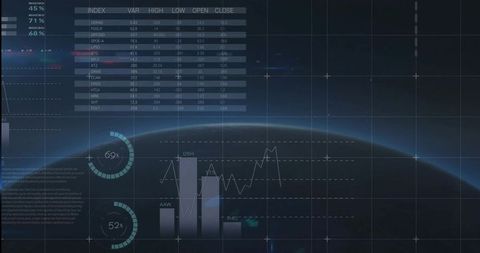
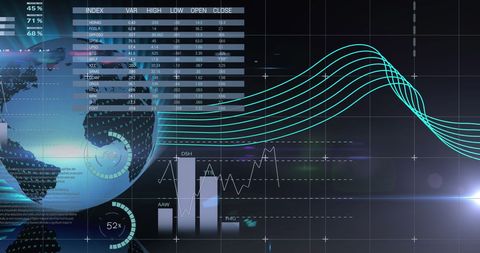
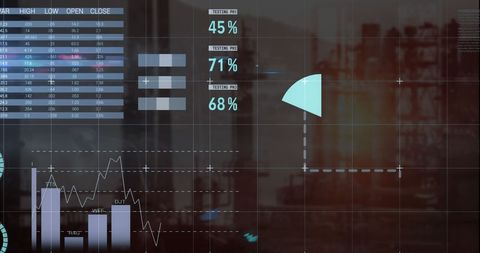
- Futuristic Financial Data Visualization
Futuristic Financial Data Visualization Image

Features an array of data visualization elements including bar charts, pie charts, and statistical readouts. Ideal for illustrating financial reports, market analysis, or presentations concerned with investment trends and digital finance transformation.
Powered by 


Credit Photo
If you would like to credit the Photo, here are some ways you can do so
Text Link
photo Link
<span class="text-link">
<span>
<a target="_blank" href=https://pikwizard.com/photo/futuristic-financial-data-visualization/30b18a776d96a659a10ec6abd38886d8/>PikWizard</a>
</span>
</span>
<span class="image-link">
<span
style="margin: 0 0 20px 0; display: inline-block; vertical-align: middle; width: 100%;"
>
<a
target="_blank"
href="https://pikwizard.com/photo/futuristic-financial-data-visualization/30b18a776d96a659a10ec6abd38886d8/"
style="text-decoration: none; font-size: 10px; margin: 0;"
>
<img src="https://pikwizard.com/pw/medium/30b18a776d96a659a10ec6abd38886d8.jpg" style="margin: 0; width: 100%;" alt="" />
<p style="font-size: 12px; margin: 0;">PikWizard</p>
</a>
</span>
</span>
Free (free of charge)
Free for personal and commercial use.
Author: Authentic Images
Similar Free Stock Images

Premium


Premium


Premium


Premium


Premium


Premium

Premium

Premium


Premium

Premium


Premium


Premium

Premium


Premium

Premium

Premium


Premium


Premium


Premium


Premium

Premium


Premium

Premium


Premium


Premium

Explore More Free Stock Images