
- Home >
- Stock Photos >
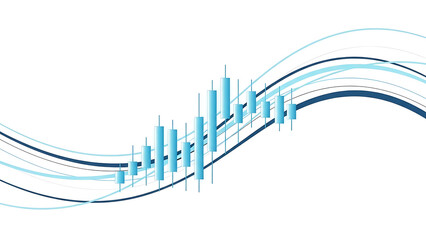
- Futuristic Financial Data Visualizations on Blue Digital Interface
Futuristic Financial Data Visualizations on Blue Digital Interface Image

Digital interface showcasing financial data visualizations with candlestick and line graphs on a dynamic blue background. Useful for financial presentations, technology websites, and economic analytics platforms highlighting market trends and data analysis sophistication.
Powered by 


downloads
Tags:
More
Credit Photo
If you would like to credit the Photo, here are some ways you can do so
Text Link
photo Link
<span class="text-link">
<span>
<a target="_blank" href=https://pikwizard.com/photo/futuristic-financial-data-visualizations-on-blue-digital-interface/3a3dea8fdb1258f71ca77e7262cf48c5/>PikWizard</a>
</span>
</span>
<span class="image-link">
<span
style="margin: 0 0 20px 0; display: inline-block; vertical-align: middle; width: 100%;"
>
<a
target="_blank"
href="https://pikwizard.com/photo/futuristic-financial-data-visualizations-on-blue-digital-interface/3a3dea8fdb1258f71ca77e7262cf48c5/"
style="text-decoration: none; font-size: 10px; margin: 0;"
>
<img src="https://pikwizard.com/pw/medium/3a3dea8fdb1258f71ca77e7262cf48c5.jpg" style="margin: 0; width: 100%;" alt="" />
<p style="font-size: 12px; margin: 0;">PikWizard</p>
</a>
</span>
</span>
Free (free of charge)
Free for personal and commercial use.
Author: People Creations
Similar Free Stock Images

Premium


Premium

Premium


Premium


Premium


Premium


Premium


Premium

Premium


Premium
Premium


Premium


Premium


Premium

Premium


Premium


Premium


Premium


Premium


Premium


Premium


Premium


Premium


Premium


Premium

Explore More Free Stock Images