
- Home >
- Stock Photos >
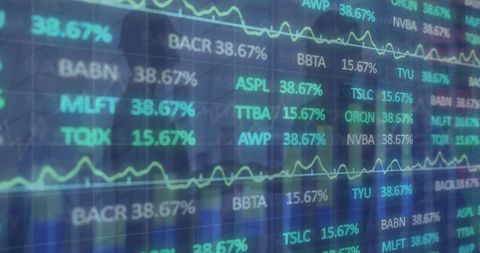
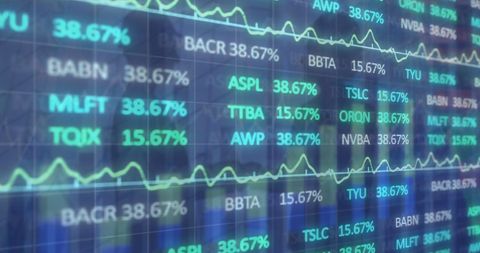
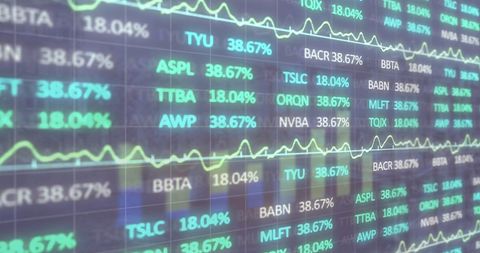
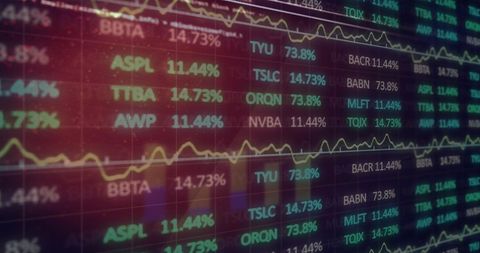
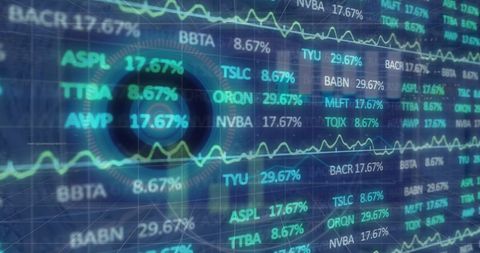
- Futuristic Financial Data with Digital Interface and Analytics
Futuristic Financial Data with Digital Interface and Analytics Image

Illustration focusing on interconnections between digital technology and stock market data. Shows electronic numbers, green decimal markers common in financial transactions. Use for depicting advanced financial analyses in fintech contexts, investment research activities, high-tech financial representations or digital economy transformations.
Powered by 


downloads
Tags:
More
Credit Photo
If you would like to credit the Photo, here are some ways you can do so
Text Link
photo Link
<span class="text-link">
<span>
<a target="_blank" href=https://pikwizard.com/photo/futuristic-financial-data-with-digital-interface-and-analytics/ab215e5a534cca31defd1d51f78da0c1/>PikWizard</a>
</span>
</span>
<span class="image-link">
<span
style="margin: 0 0 20px 0; display: inline-block; vertical-align: middle; width: 100%;"
>
<a
target="_blank"
href="https://pikwizard.com/photo/futuristic-financial-data-with-digital-interface-and-analytics/ab215e5a534cca31defd1d51f78da0c1/"
style="text-decoration: none; font-size: 10px; margin: 0;"
>
<img src="https://pikwizard.com/pw/medium/ab215e5a534cca31defd1d51f78da0c1.jpg" style="margin: 0; width: 100%;" alt="" />
<p style="font-size: 12px; margin: 0;">PikWizard</p>
</a>
</span>
</span>
Free (free of charge)
Free for personal and commercial use.
Author: Creative Art
Similar Free Stock Images

Premium


Premium


Premium


Premium


Premium

Premium


Premium


Premium


Premium


Premium

Premium


Premium


Premium


Premium


Premium


Premium


Premium


Premium


Premium


Premium


Premium


Premium


Premium


Premium


Premium

Explore More Free Stock Images