1. Home > 
  2. Stock Photos > 
  3. Futuristic Financial Graph with Binary Code Overlay

Futuristic Financial Graph with Binary Code Overlay Image

Futuristic Financial Graph with Binary Code Overlay

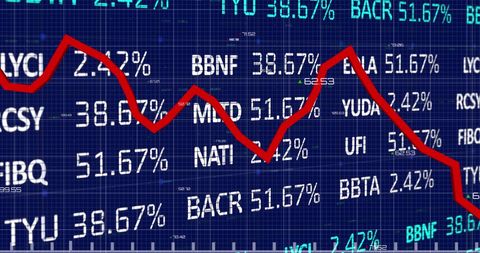
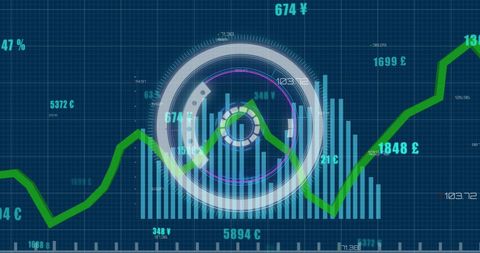
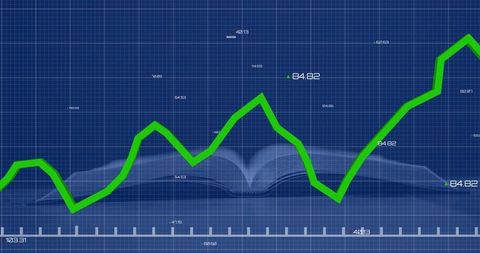
Bar chart with binary code and currency symbols creating dynamic financial portrayal. Ideal for financial reports, digital currency blogs, and technology-driven investment websites. Highlights futuristic digital interface concept.

Powered by Shutterstock logo - Get 15% off with code: PIKWIZARD15
Big data visualization concept. Machine learning algorithms. Analysis of information. Technology data and binary code network conveying connectivity, complexity and data flood of modern digital age. - Powered by Shutterstock - Get 15% off with code: PIKWIZARD15Business Analytics Finance Neural Network AI Big Data Technology Data scientists query, analyze, and visualize complex datasets on a virtual screen. information flow concept processing of bigdata - Powered by Shutterstock - Get 15% off with code: PIKWIZARD15Person using a laptop with financial data visualizations and binary code on a dark background. Concept of fintech and algorithmic trading - Powered by Shutterstock - Get 15% off with code: PIKWIZARD15futuristic digital visualization of global import tariffs and trade data - Powered by Shutterstock - Get 15% off with code: PIKWIZARD15Software engineering working on big data digital information innovation technology analysis network system cyberspace binary code flow futuristic statistic business design concept computer model - Powered by Shutterstock - Get 15% off with code: PIKWIZARD15

Credit Photo

If you would like to credit the Photo, here are some ways you can do so

Free (free of charge)

Free for personal and commercial use.

Author: Creative Art

Similar Free Stock Images

Abstract Digital Graph with Data Points and Grid
Premium
Displaying digital globe streaming binary code over corporate façade, with stock tickers. Data visualization, financial technology, corporate architecture, digital innovation, market analysis,
Digital Data Analysis Against Abstract Cityscape
Red Line Graph Over Histogram Representing Financial Volatility
Digital Urban Cityscape with Abstract Sound Waves
Financial Data Charts with World Map on Blue Digital Background
Premium
Collage with analyst using AI data visualization for market growth. Concept of artificial intelligence in financial analytics, corporate decision-making, fintech strategy, and investment forecasting.
Financial Data Through Digital Networks with Stock Market Growth Trend
Fluctuating Digital Stock Market Data Chart
Financial Growth Trends Over Cityscape Background
Futuristic Digital Dashboard with Business Data Analytics
Premium
futuristic digital visualization of global import tariffs and trade data
Abstract Neon Shapes over Financial Data Screen
Digital Financial Data and Global Market Analysis on Graph
Data Analysis and Cybersecurity Concept Art
Digital Financial Data and Multicurrency Exchange Charts
Premium
Dynamic financial background with green candlestick stock market chart, digital data, and binary code overlay. Concept for financial growth, positive stock market trends and investment success
Financial Growth Chart with Dynamic Green Line on Grid Overlay
Futuristic Data Processing Interface with Dynamic Graphs
Digital Financial Data Interfaces in Global Connection
Binary Code and Financial Data on Digital Screen
Premium
Business Analytics Finance Neural Network AI Big Data Technology Data scientists query, analyze, and visualize complex datasets on a virtual screen. information flow concept processing of bigdata
Fluctuating Stock Market Graph with Symbols and Percentages
Financial Data Analysis with Interactive Graphs
Futuristic Data Trend Graphs on Digital Interface
Fluctuating Financial Graph on Green Grid Background
Premium
Image of financial data and globe over binary code on blue background. Global finance, economy and computers concept digitally generated image.
Analyzing Growing Graph Line on Purple Gradient Background
Green Line Graph on Dark Digital Grid
Financial Graph Showing Indices Trends on Blue Background
Analytics Dashboard with Dynamic Financial Graphs and Data
Digital Data Processing Interface with Code and Graph
Cityscape Enhances Financial Data Visualization Digital Concept
Premium
Business analytics, finance, neural network, AI,Big data technology and data science. Data scientist querying, analysing and visualizing
Fluctuating Financial Graph With Data Visualization
Declining Graph with 49% Reduction on Dark Digital Background
Digital Analytics Interface with Vibrant Data Display
Dynamic Financial Data Analysis with Virtual Screen
Premium
Typing man focusing on laptop keyboard in dark office, with globe, binary code and market charts. Technology, finance, data analysis, digital, innovation, cybersecurity, business
Digital Data Analysis with Green Line Graph on Grid Background
Diverse Graphical Data on Digital Financial Interface Concept
Dynamic Green Line Graph Showing Financial Data Fluctuations
Rising Green Line Chart Overlays Concept of Financial Growth
Premium
futuristic digital visualization of global import tariffs and trade data
Global Data Exchange Network
Abstract Digital Data with Upward Trending Line Graph
Interactive Business Graph with Currency Data and Analytics
Green Data Graph on Black Digital Interface
Premium
Showing translucent line graph overlay over coastal homes, with candlestick and binary code. Seascape, financialtechnology, digitalvisualization, dataanalysis, moderndesign, strategicplanning,
Futuristic Financial Data Visualization with Graph
Declining Stock Market Graph with Red Trend Line
Binary Code Financial Analytics with Rising Graph Line
Digital Financial Graphs and Stock Market Data Visualization
Premium
Creative visual of business big data and finance analysis on computer showing concept of statistical investment decision making methodology, fintech and financial engineering .
Dynamic Red Line Graph With Data Points on Gridded Background
Financial Data Analysis with Digital Graph Overlay
Financial Data Analytics Overlaying Digital World Map Background
Financial Data Analysis with Declining Trend on Blueprint Graph
Premium
Image of financial data and graph over binary code on blue background. Global finance, economy and computers concept digitally generated image.
Dynamic Financial Stock Market Analysis Display
Dynamic Digital Stock Market Chart with Growing Financial Trends
Dynamic Time-Series Data Visualization on Digital Dashboard
Digital Interface with Data Processing Visualization
Financial Data Chart Over City Silhouette
Dynamic Financial Data Visualization over Urban Silhouette
Premium
Man in glasses thinking, surrounded by futuristic digital swirl patterns and data streams, symbolizing innovation, technology, artificial intelligence, and deep analytical thinking.
Global Financial Data and Graph Analysis Technology
Digital Financial Analysis with Infographic and Data Flow
Digital Data Visualization on Grid Display
Dynamic Stock Market Data with Fluctuating Graph
Premium
Hand using a pen to interact with digital financial charts and algorithmic lines on a dark background. Concept of fintech and automated trading interface
Digital Data Analysis with Security Threat Warning
Declining Financial Market Chart Over Grid Background
Green Financial Line Chart Over Modern Office Buildings
Bright Green Sales Statistics on Futuristic Grid Display
Premium
Rotating Earth globe showing binary overlay in data space, with colored line graphs and percentages. Globes, data visualization, digital analytics, financial trends, futuristic design, technological,
Digital Data Analysis Visualization with Graphs
Rising Graph Line on Digital Green Grid Background
Digital Data Processing Interface with Green Growth Chart
Financial Data Analysis with Trend Line and Statistics
Premium
futuristic digital visualization of global import tariffs and trade data
Digital Finance Art with Graphs and Currency Symbols Overlapping
Business Data Technology Concept with Grid Overlay
Digital Financial Report Analysis Overlaid on Office Scene
Global Financial Decline Chart with Red Trend Line
Premium
Image of financial data processing and binary coding over wind turbines. Global data processing, sustainability and environment concept digitally generated image.
Dynamic Financial Data on Dark Background With Colorful Graphs
Financial Data Visualization with Global Network Elements
Digital Data Visualization with Graphs on Gradient Background
Global Data Processing with Dynamic Graph Visualization
Premium
Showcasing female athlete wearing pink sports top in dark studio, with digital data overlays. Futuristic, tech, innovation, data visualization, athletic, dynamic, modern
Digital Financial Chart and Global Currency Symbols on Blue Background
Social Media Engagement on Analytical Dashboard Display
Digital Currency Trading Interface with Data Visualization
Financial Graph and Cityscape Analysis with Technological Overlay
Financial Graph Over Cityscape Depicting Data Trends and Analytics
Cityscape with Vertical Columns on Black Background
Premium
futuristic digital visualization of global import tariffs and trade data
Futuristic Interface Displaying Dynamic Data Waves
Digital Financial Data Analytics and Economic Trends
Dynamic Stock Market Data Display in Red and Green Ticker
Futuristic Graph and Data Visualization Interface Design
Premium
Displaying multicolored bars, red turquoise line graphs on screen, with streaming binary digits. Data visualization, financial analytics, digital interface, cyber security, technology, futuristic,
Green Financial Line Graph with Candlestick Data on Grid Background
Green Line Chart with Financial Data on Digital Display
Digital DNA and Data Analytics Fusion Visualization
Digital Lock with Real-Time Data Display
Premium
Displaying analytics interface overlaying computer screen, with binary streams and ticker symbols. Technology, data visualization, digital, futuristic, analysis, finance, software
Digital Interface Displaying Volatile Financial Market Analysis
Dynamic Financial Data Representation on Digital Grid
Stock Market Downturn Depicted with Red Line on Blue Digital Display
Financial Chart with Dynamic Numbers on Grid Background
Premium
Visual representation of big data processing and binary code integration. Showcases AI, machine learning, and data flow concepts, emphasizing innovation in analytics and data-driven technology.
Abstract Digital Finance Background with Graphs and Data Visualization
Dynamic Financial Chart with Red Line Graph on Digital Interface
Sharp Decline in Stock Market Graph Against Red Financial Data Background
Green Line Graph with Data Points on Grid Background
Premium
Displaying orange zigzag chart traversing binary digits on screen with grid lines and percentages. Data, visualization, digital, analytics, technology, interface, finance
Futuristic Data Processing with Interactive Diagrams
Fluctuating Financial Graph on Digital Orange Background
Falling Stock Market Data with Red Line Indicator
Dynamic Financial Growth Charts and Binary Code Overlay
Premium
Image of financial data processing over electricity pylons and landscape. global finance, business and digital interface concept digitally generated image.
Blueprint Analysis with Green Line Graph on Open Book