- Home >
- Stock Photos >
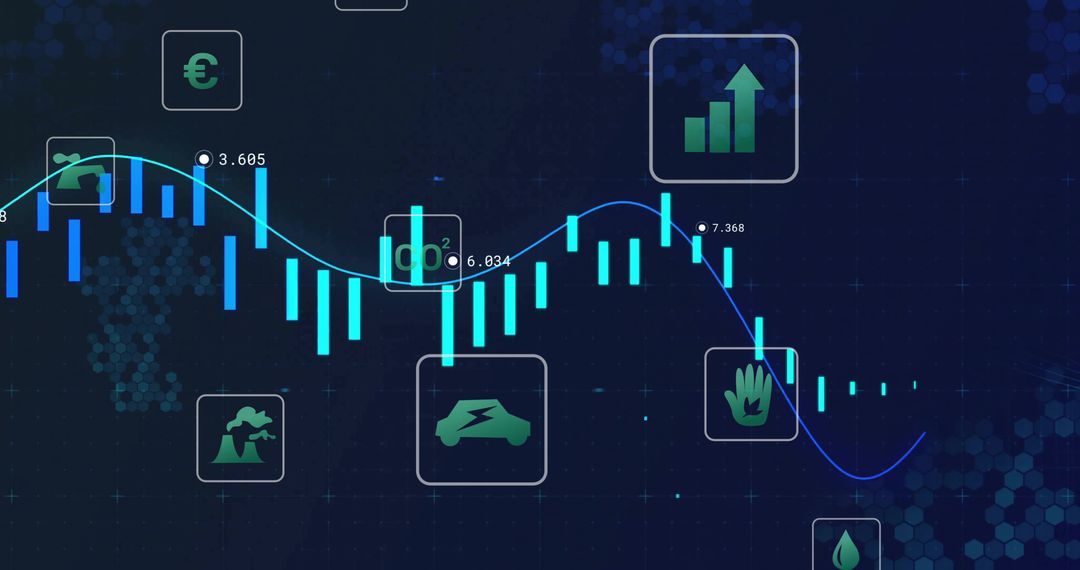
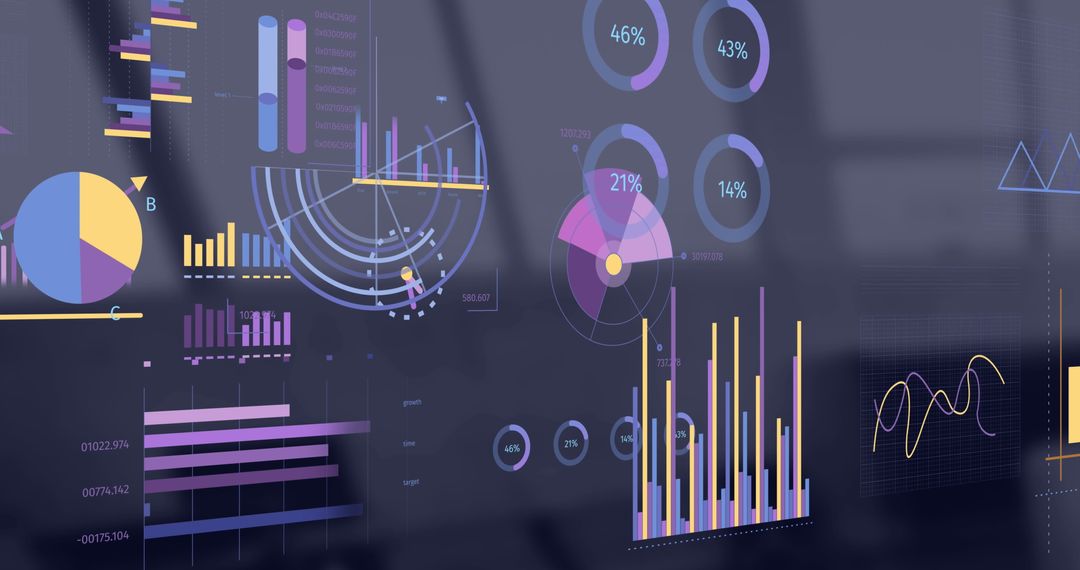
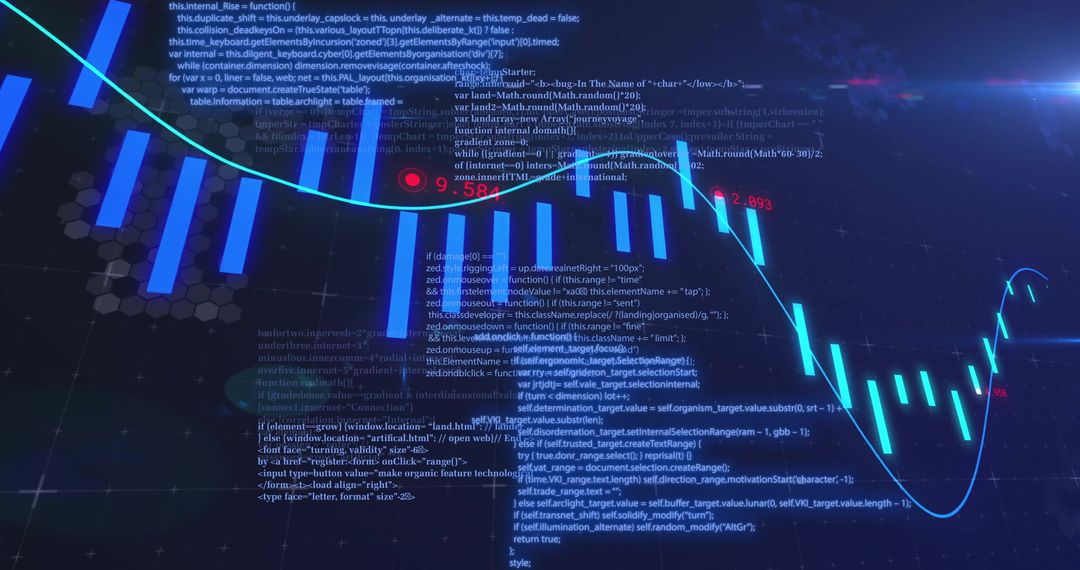
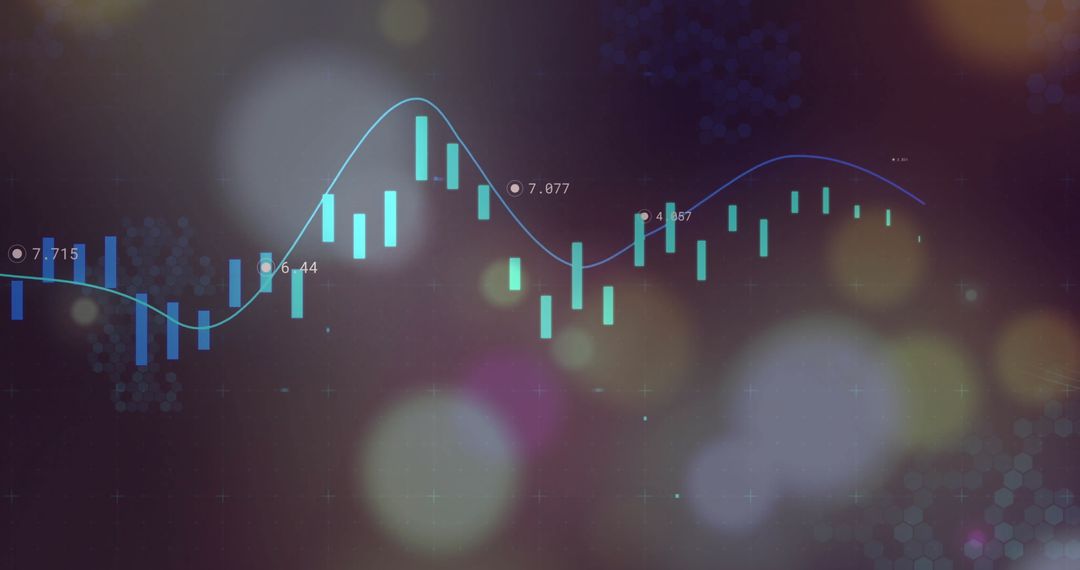
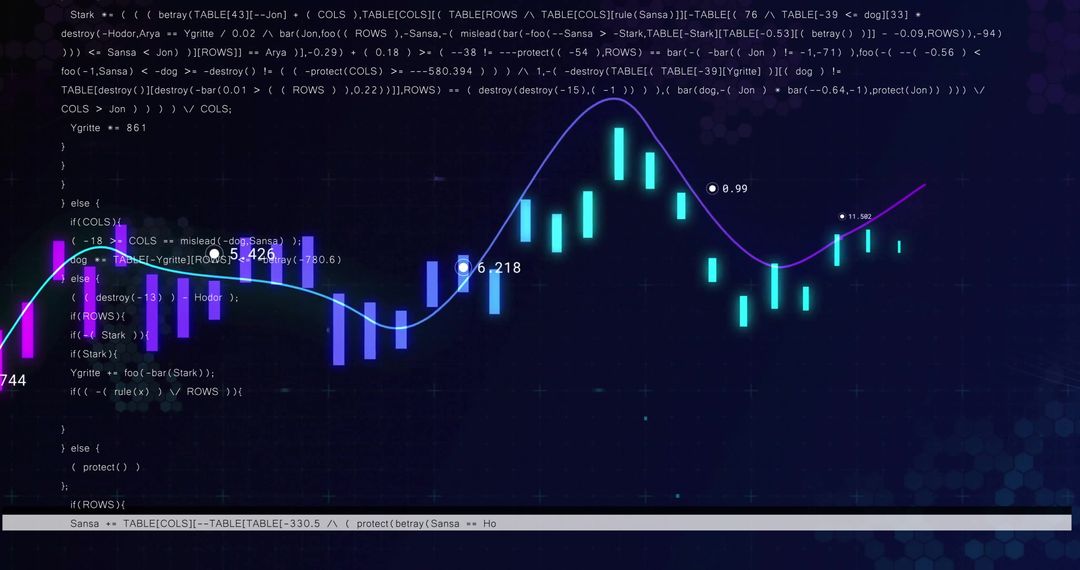
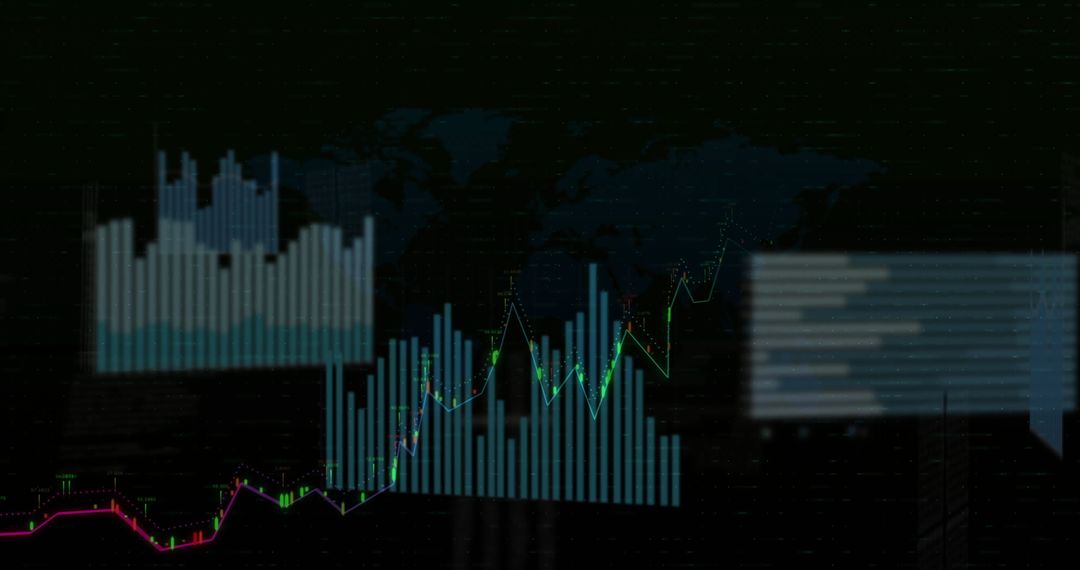
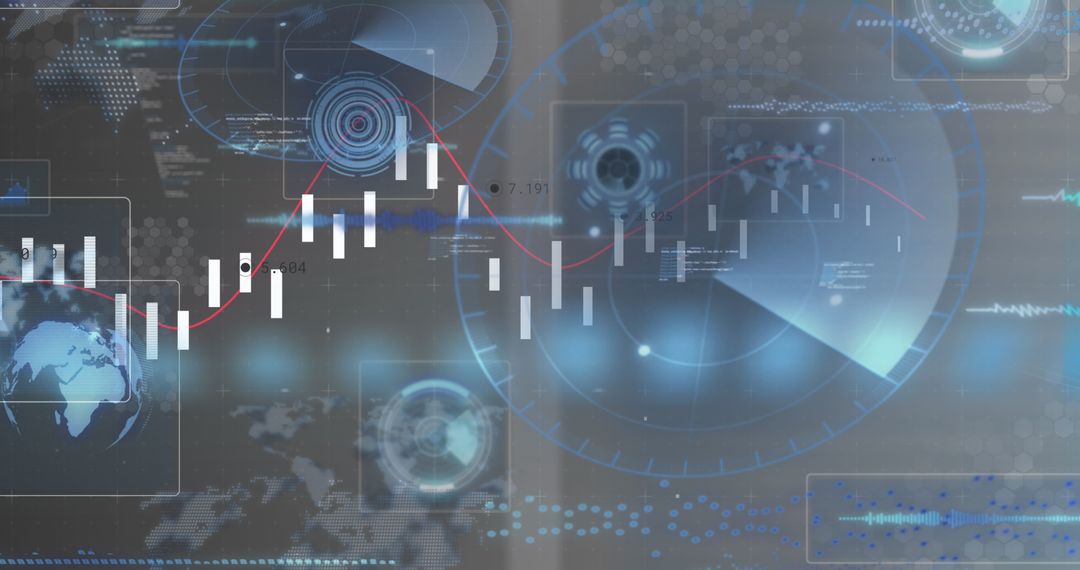
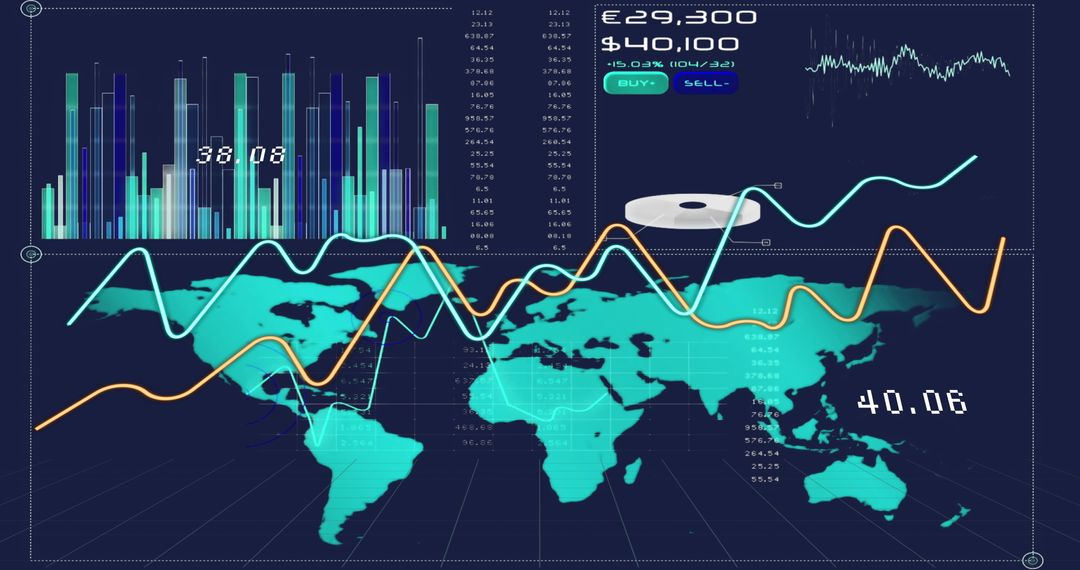
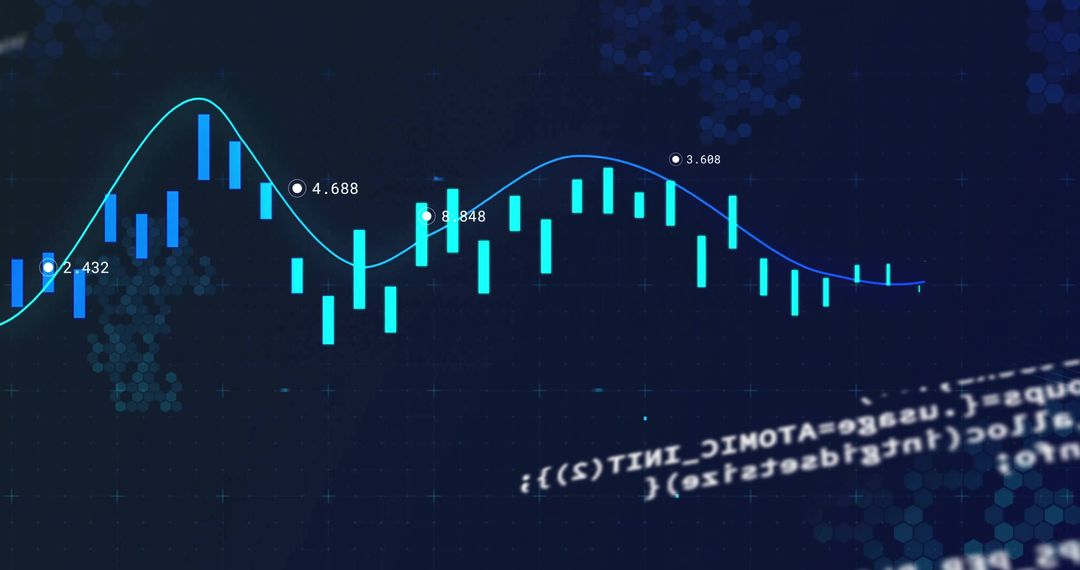
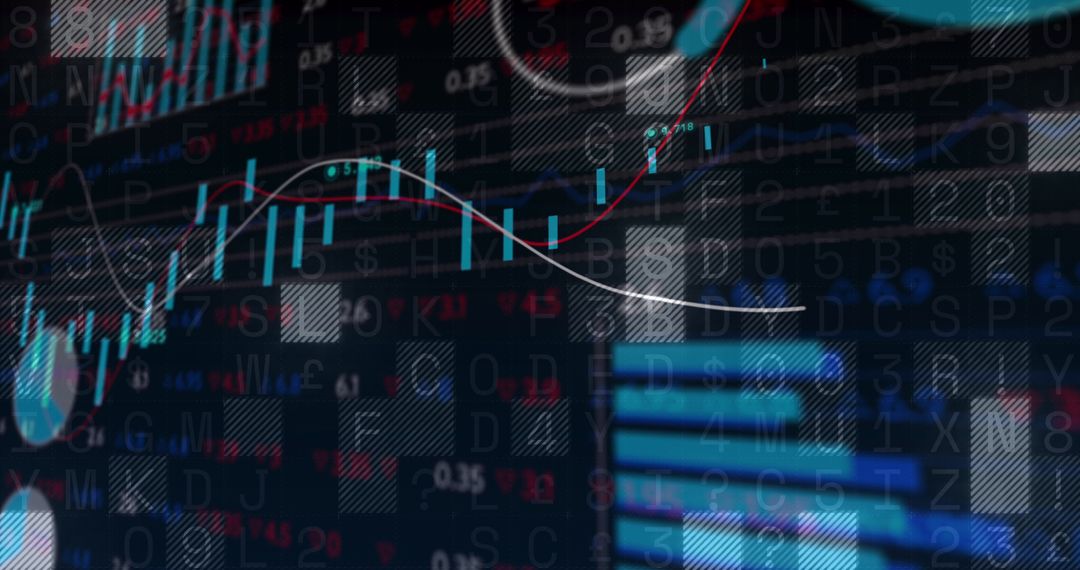
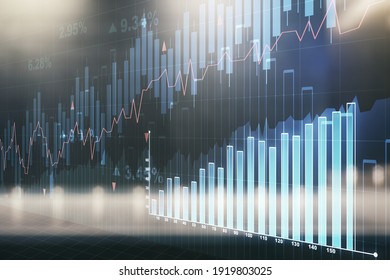
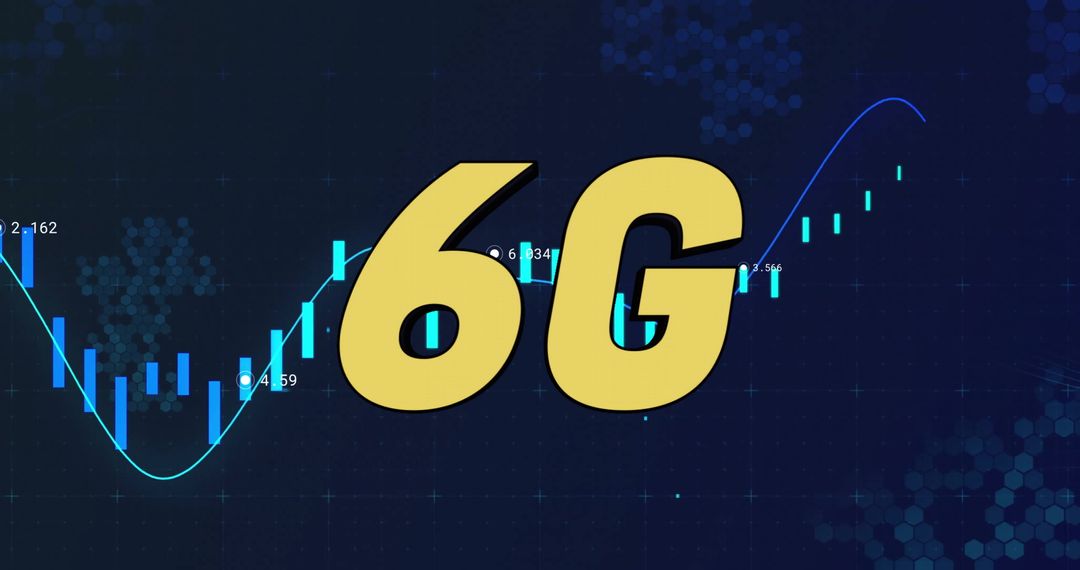
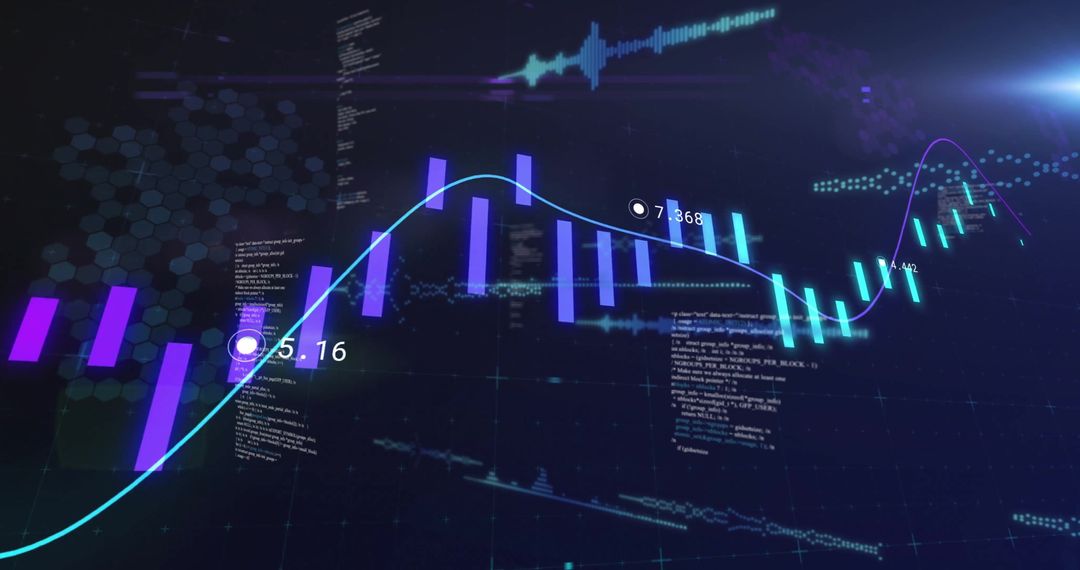
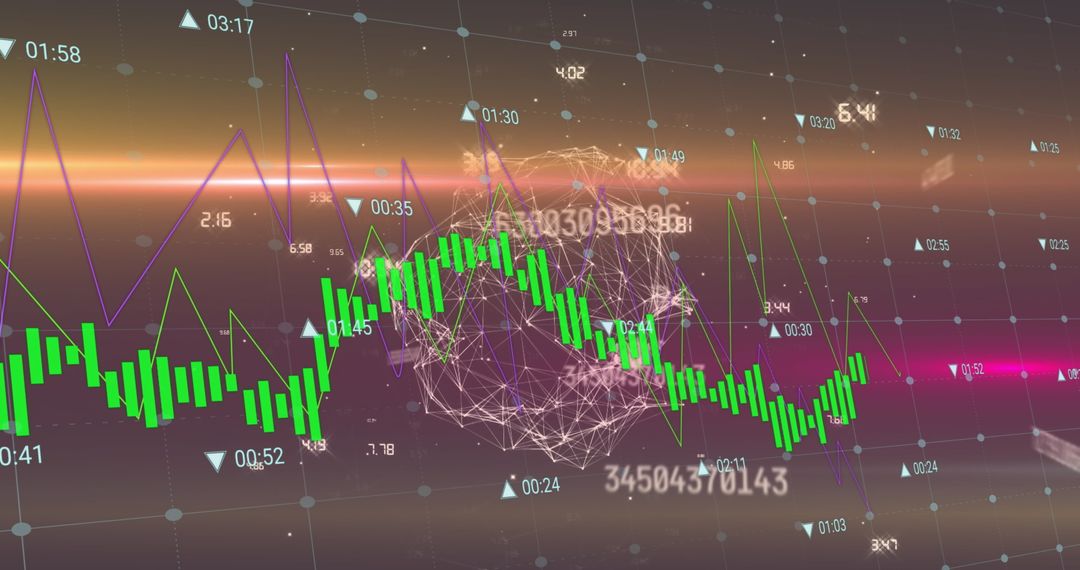
- Futuristic Financial Graph with Glowing Candlestick Bars and Data Panels
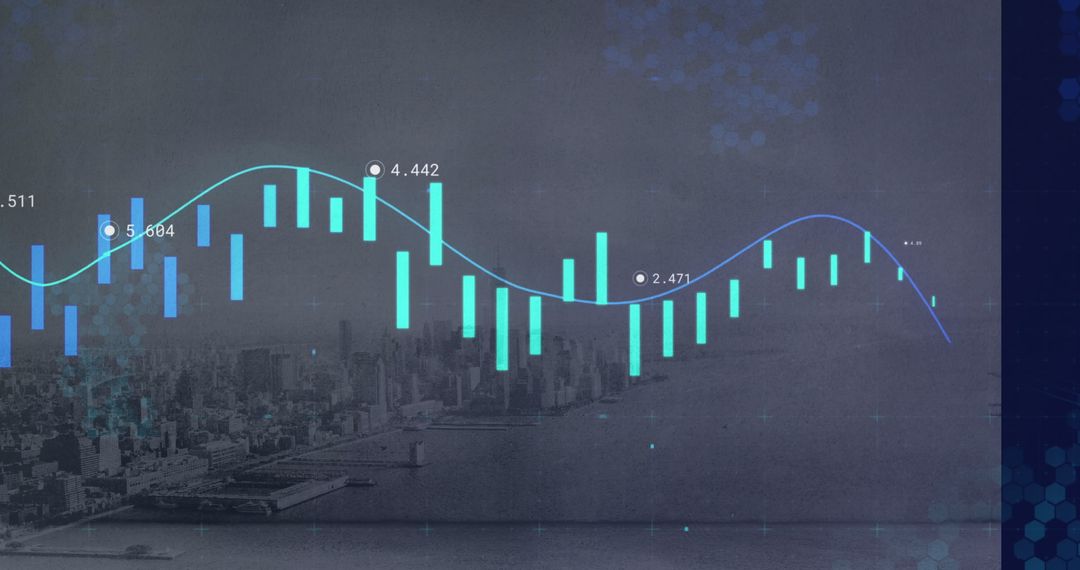
Futuristic Financial Graph with Glowing Candlestick Bars and Data Panels Image
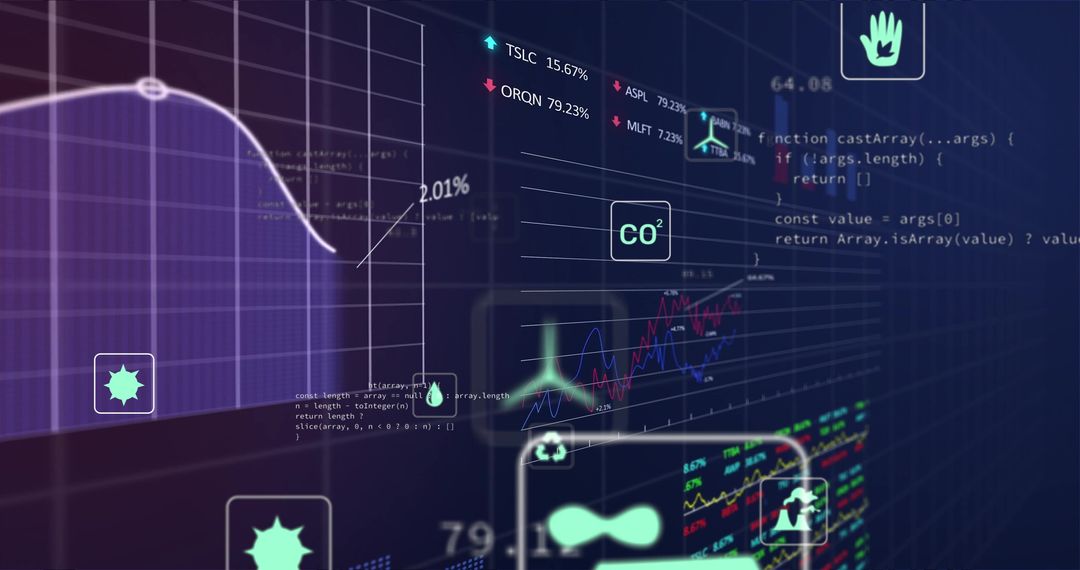
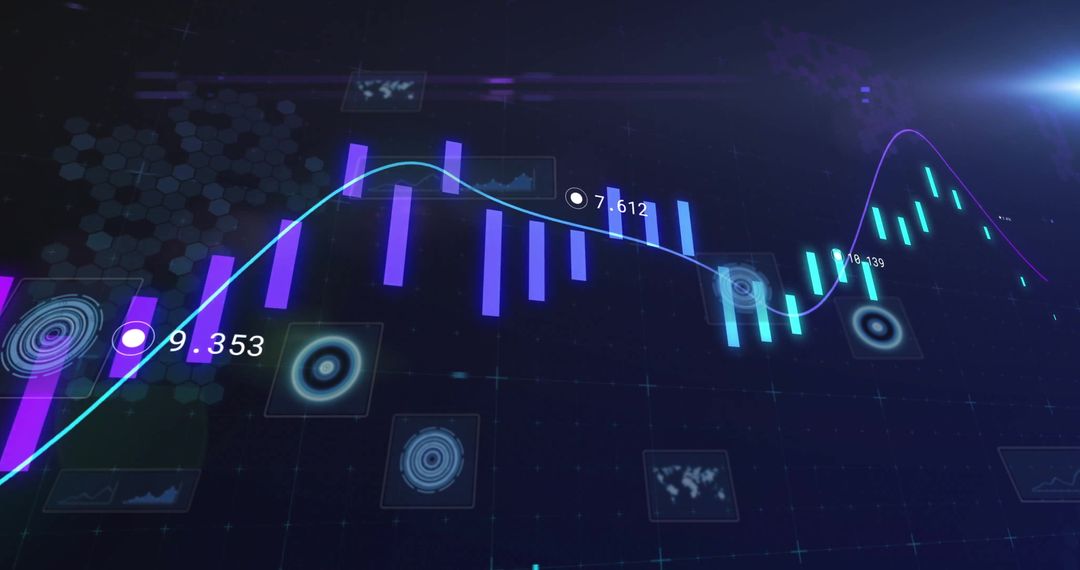
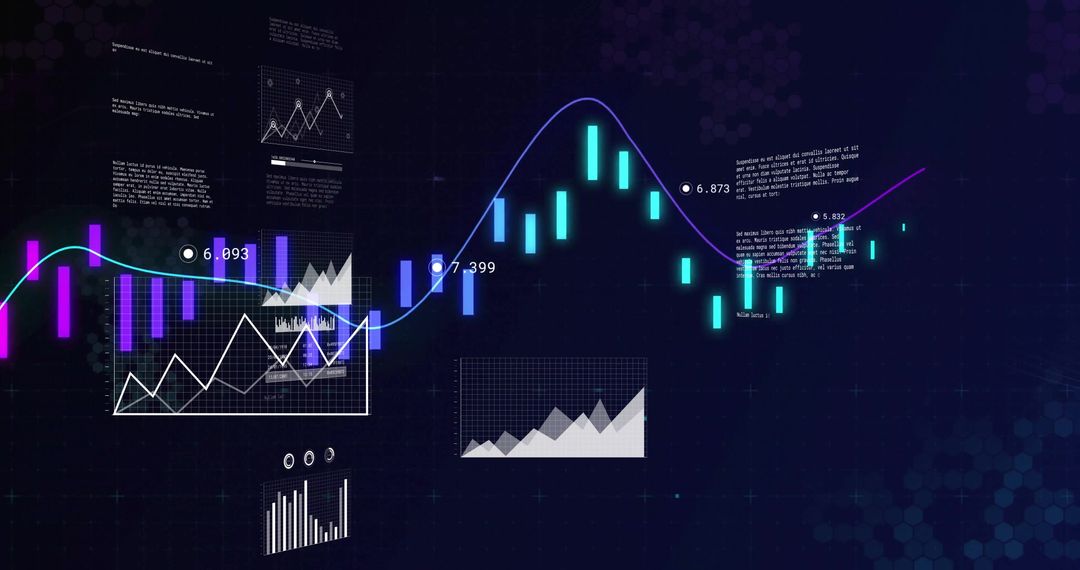
Image showcases a glowing cyan candlestick chart with an overlaying blue trend line on a digital trading dashboard, surrounded by multiple data panels. Represents themes of technology-driven financial analysis, offering a futuristic view of stock market trends and analytics. Suitable for use on financial blogs, stock market news articles, investment websites, and presentations on technology in finance.
Powered by  - Get 15% off with code: PIKWIZARD15


0
downloads
downloads
Tags:
More
Credit Photo
If you would like to credit the Photo, here are some ways you can do so
Text Link
photo Link
<span class="text-link">
<span>
<a target="_blank" href=https://pikwizard.com/photo/futuristic-financial-graph-with-glowing-candlestick-bars-and-data-panels/a6442a51edfbe9d0917b4422a3c3fe1f/>PikWizard</a>
</span>
</span>
<span class="image-link">
<span
style="margin: 0 0 20px 0; display: inline-block; vertical-align: middle; width: 100%;"
>
<a
target="_blank"
href="https://pikwizard.com/photo/futuristic-financial-graph-with-glowing-candlestick-bars-and-data-panels/a6442a51edfbe9d0917b4422a3c3fe1f/"
style="text-decoration: none; font-size: 10px; margin: 0;"
>
<img src="https://pikwizard.com/pw/medium/a6442a51edfbe9d0917b4422a3c3fe1f.jpg" style="margin: 0; width: 100%;" alt="" />
<p style="font-size: 12px; margin: 0;">PikWizard</p>
</a>
</span>
</span>
Free (free of charge)
Free for personal and commercial use.
Author: Authentic Images
Similar Free Stock Images

Premium


Premium


Premium


Premium


Premium


Premium


Premium


Premium


Premium


Premium


Premium


Premium


Premium


Premium


Premium


Premium


Premium


Premium


Premium


Premium


Premium


Premium

Premium


Premium