- Home >
- Stock Photos >
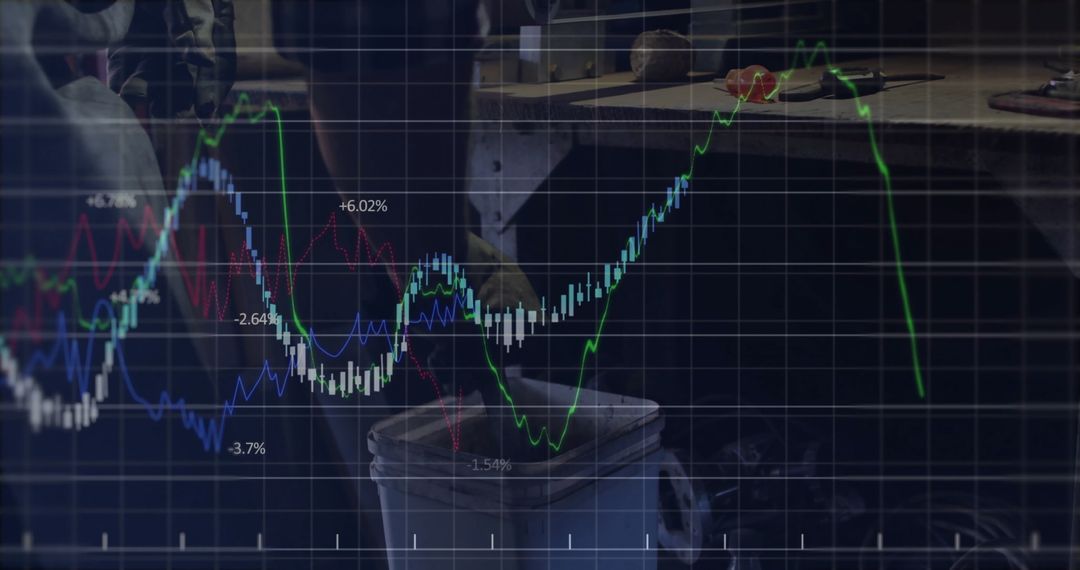
- Futuristic Financial Graphs and Rising Arrows in Data Interface
Futuristic Financial Graphs and Rising Arrows in Data Interface Image

Futuristic financial display featuring red-colored graphs and arrows indicating market growth, overlaid with a digital interface grid and real-time ticker text. Suitable for illustrating financial services, economic reports, trading software, and investment opportunities, conveying a modern and technologically advanced view of market dynamics.
Powered by 


0
downloads
downloads
Tags:
More
Credit Photo
If you would like to credit the Photo, here are some ways you can do so
Text Link
photo Link
<span class="text-link">
<span>
<a target="_blank" href=https://pikwizard.com/photo/futuristic-financial-graphs-and-rising-arrows-in-data-interface/6b71a273751e35033d32c107eb86042f/>PikWizard</a>
</span>
</span>
<span class="image-link">
<span
style="margin: 0 0 20px 0; display: inline-block; vertical-align: middle; width: 100%;"
>
<a
target="_blank"
href="https://pikwizard.com/photo/futuristic-financial-graphs-and-rising-arrows-in-data-interface/6b71a273751e35033d32c107eb86042f/"
style="text-decoration: none; font-size: 10px; margin: 0;"
>
<img src="https://pikwizard.com/pw/medium/6b71a273751e35033d32c107eb86042f.jpg" style="margin: 0; width: 100%;" alt="" />
<p style="font-size: 12px; margin: 0;">PikWizard</p>
</a>
</span>
</span>
Free (free of charge)
Free for personal and commercial use.
Author: People Creations
Similar Free Stock Images

Premium


Premium


Premium


Premium


Premium


Premium


Premium


Premium


Premium


Premium


Premium


Premium


Premium


Premium


Premium


Premium


Premium


Premium


Premium


Premium


Premium


Premium


Premium


Premium