- Home >
- Stock Photos >
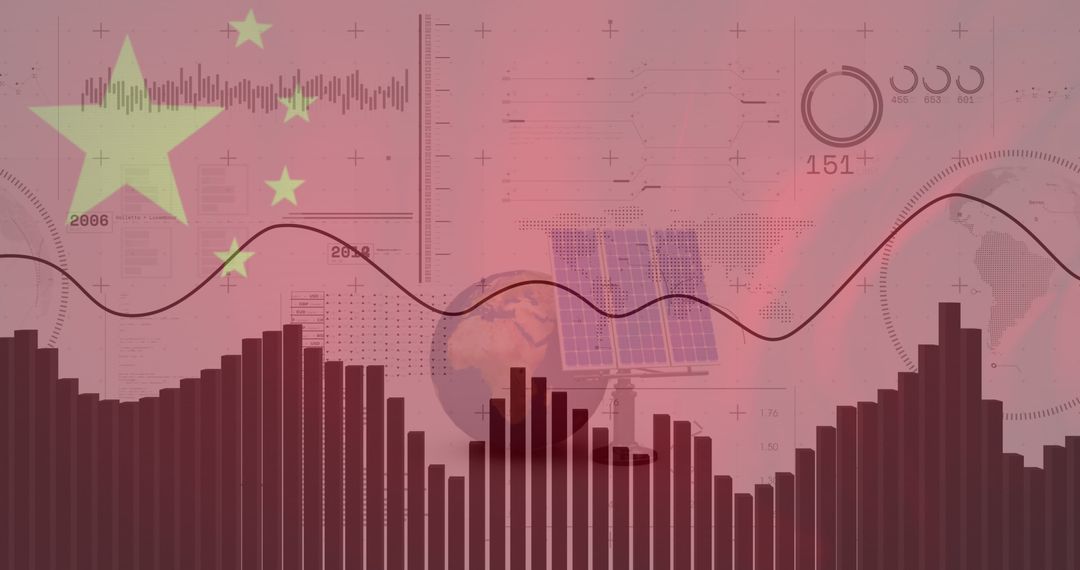
- Futuristic Financial Growth Analysis with Red Graphs and Digital Elements
Futuristic Financial Growth Analysis with Red Graphs and Digital Elements Image

Concept of financial growth illustrated with red bar graphs against a backdrop of global maps and transparent globe. Perfect for financial reports, investment strategy presentations, or economic trend analysis visuals. Emphasizes futuristic and digital elements in a clean and modern design.
Powered by 


2
downloads
downloads
Tags:
More
Credit Photo
If you would like to credit the Photo, here are some ways you can do so
Text Link
photo Link
<span class="text-link">
<span>
<a target="_blank" href=https://pikwizard.com/photo/futuristic-financial-growth-analysis-with-red-graphs-and-digital-elements/48e390ff4e6f80a2c26249666e3b61f4/>PikWizard</a>
</span>
</span>
<span class="image-link">
<span
style="margin: 0 0 20px 0; display: inline-block; vertical-align: middle; width: 100%;"
>
<a
target="_blank"
href="https://pikwizard.com/photo/futuristic-financial-growth-analysis-with-red-graphs-and-digital-elements/48e390ff4e6f80a2c26249666e3b61f4/"
style="text-decoration: none; font-size: 10px; margin: 0;"
>
<img src="https://pikwizard.com/pw/medium/48e390ff4e6f80a2c26249666e3b61f4.jpg" style="margin: 0; width: 100%;" alt="" />
<p style="font-size: 12px; margin: 0;">PikWizard</p>
</a>
</span>
</span>
Free (free of charge)
Free for personal and commercial use.
Author: People Creations
Similar Free Stock Images

Premium


Premium


Premium


Premium


Premium


Premium


Premium


Premium


Premium


Premium


Premium


Premium


Premium


Premium


Premium


Premium


Premium


Premium


Premium


Premium


Premium


Premium


Premium


Premium