
- Home >
- Stock Photos >
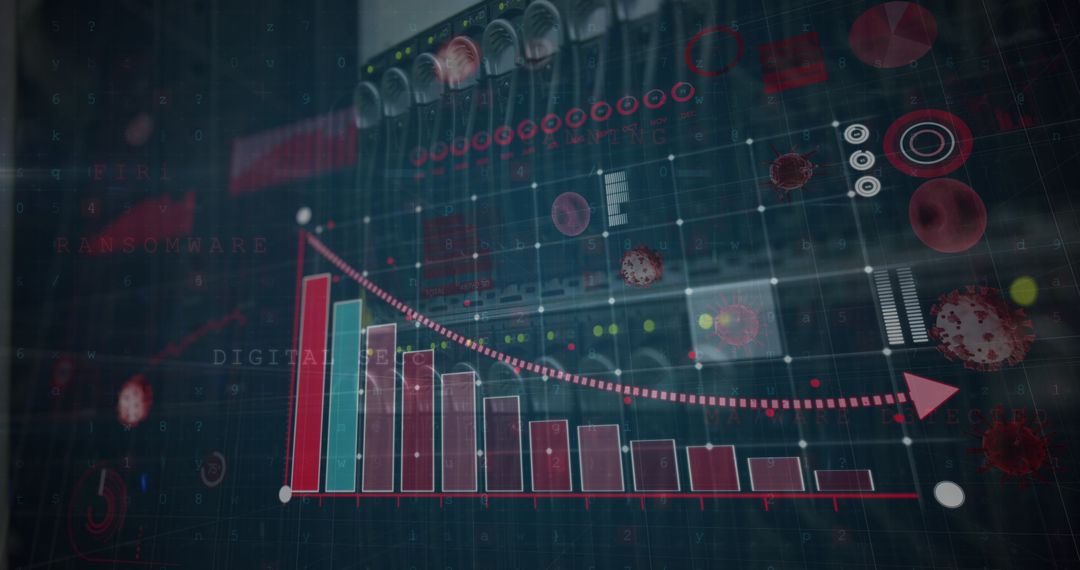
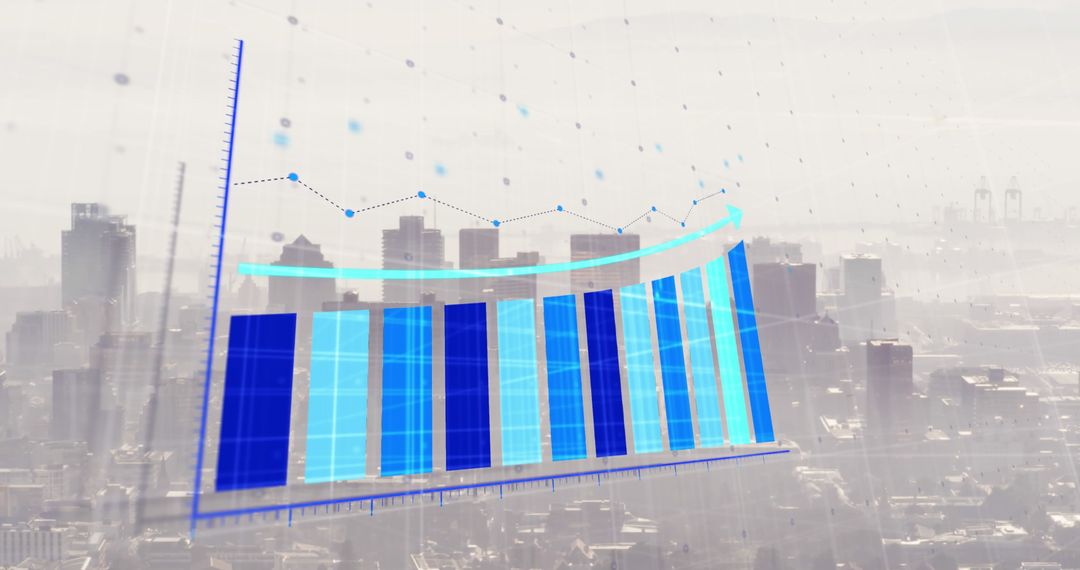
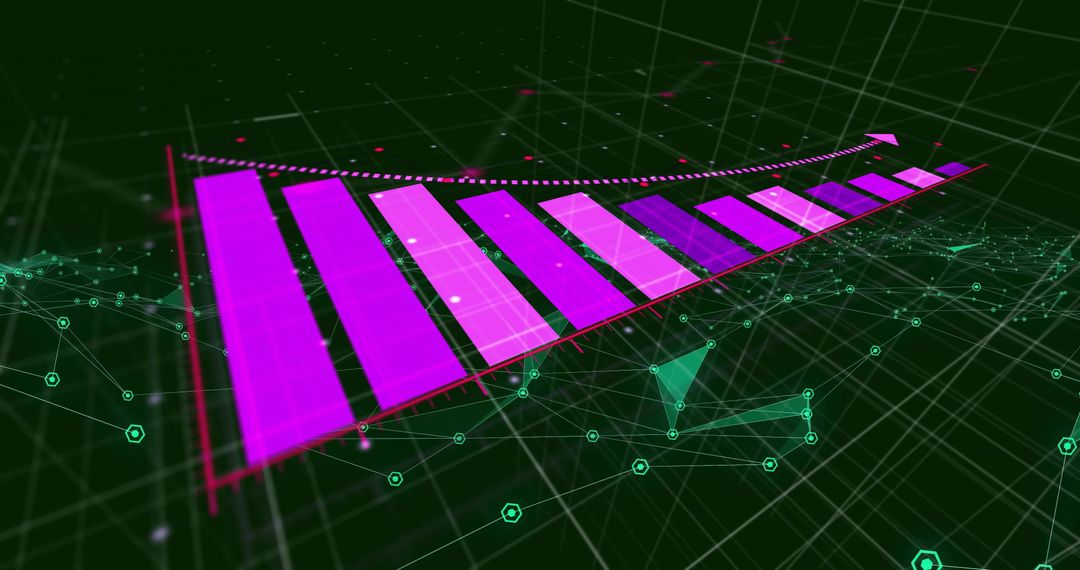
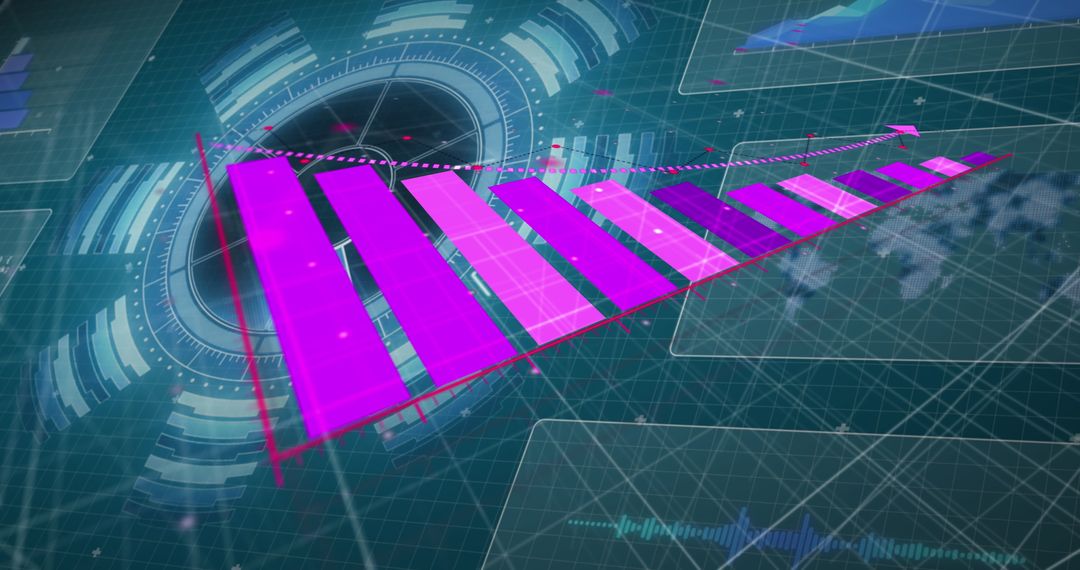
- Futuristic Financial Growth Chart with Sci-Fi Digital Interface
Futuristic Financial Growth Chart with Sci-Fi Digital Interface Image

Vivid and imaginative financial infographic showcasing an upward trending bar chart, surrounded by various digital elements like virus shapes and particles, all set against a glowing grid representation. This image serves as a great asset for presentations on economic trends, financial market strategies, or data analytics in both business and educational contexts. It envisions futuristic business scenarios or advancements in technological analyses, making it ideal for conveying abstract economic assumptions or technology forward futures.
Powered by  - Get 15% off with code: PIKWIZARD15


0
downloads
downloads
Tags:
More
Credit Photo
If you would like to credit the Photo, here are some ways you can do so
Text Link
photo Link
<span class="text-link">
<span>
<a target="_blank" href=https://pikwizard.com/photo/futuristic-financial-growth-chart-with-sci-fi-digital-interface/248d01ed698187fac4141678a5c3bf16/>PikWizard</a>
</span>
</span>
<span class="image-link">
<span
style="margin: 0 0 20px 0; display: inline-block; vertical-align: middle; width: 100%;"
>
<a
target="_blank"
href="https://pikwizard.com/photo/futuristic-financial-growth-chart-with-sci-fi-digital-interface/248d01ed698187fac4141678a5c3bf16/"
style="text-decoration: none; font-size: 10px; margin: 0;"
>
<img src="https://pikwizard.com/pw/medium/248d01ed698187fac4141678a5c3bf16.jpg" style="margin: 0; width: 100%;" alt="" />
<p style="font-size: 12px; margin: 0;">PikWizard</p>
</a>
</span>
</span>
Free (free of charge)
Free for personal and commercial use.
Author: Authentic Images
Similar Free Stock Images

Premium


Premium


Premium


Premium


Premium


Premium


Premium


Premium


Premium


Premium


Premium


Premium


Premium


Premium


Premium


Premium


Premium


Premium


Premium


Premium


Premium


Premium


Premium


Premium

