- Home >
- Stock Photos >
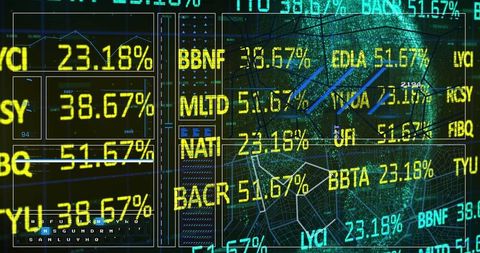
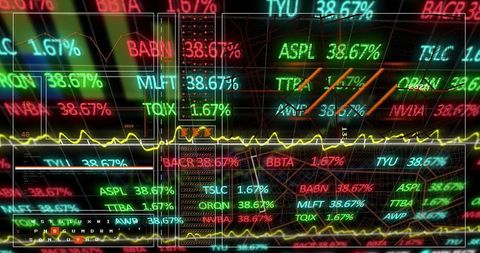
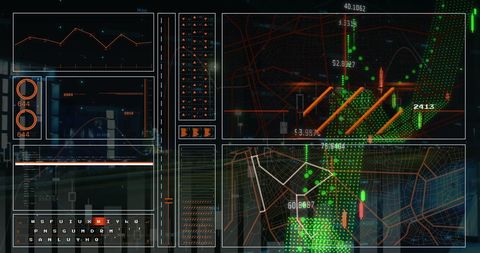
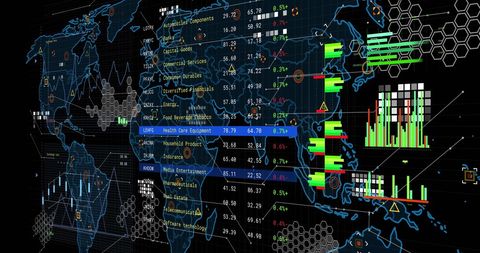
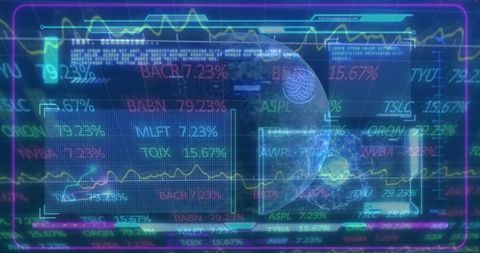
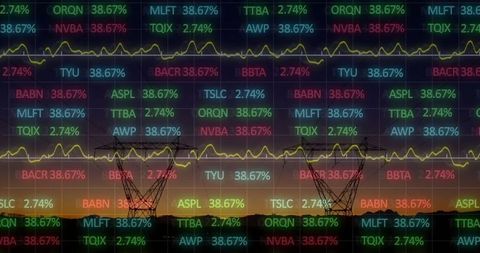
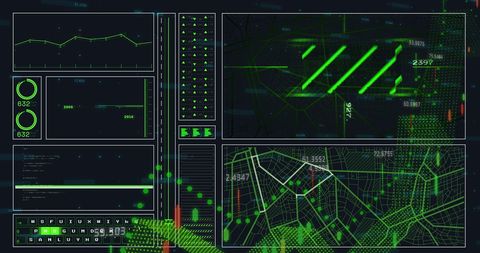
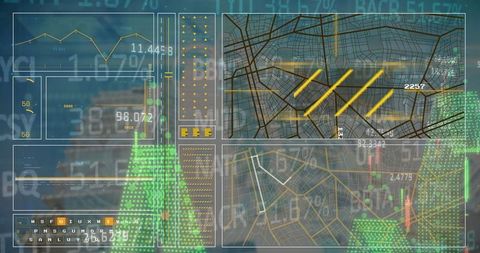
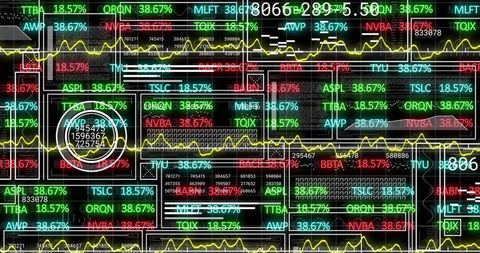
- Futuristic Financial Interface Dashboard with Colorful Data Visualization
Futuristic Financial Interface Dashboard with Colorful Data Visualization Image
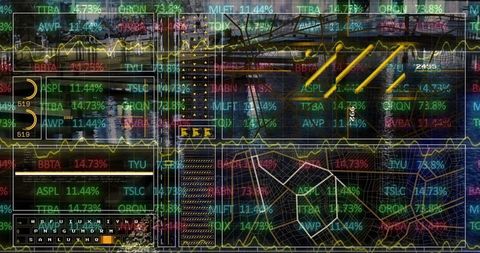
This visual features a modern and futuristic digital interface displaying financial data analysis with colorful tickers and line graphs overlapping an urban scene. Suitable for use in presentations, articles, or marketing materials related to finance and technology, illustrating cutting-edge analytics and data visualization. It conveys a high-tech corporate atmosphere and is ideal for emphasizing innovation in finance and business intelligence solutions.

downloads
Tags:
More
Credit Photo
If you would like to credit the Photo, here are some ways you can do so
Text Link
photo Link
<span class="text-link">
<span>
<a target="_blank" href=https://pikwizard.com/photo/futuristic-financial-interface-dashboard-with-colorful-data-visualization/870ee9a011538b1aef95967ee98e4cb8/>PikWizard</a>
</span>
</span>
<span class="image-link">
<span
style="margin: 0 0 20px 0; display: inline-block; vertical-align: middle; width: 100%;"
>
<a
target="_blank"
href="https://pikwizard.com/photo/futuristic-financial-interface-dashboard-with-colorful-data-visualization/870ee9a011538b1aef95967ee98e4cb8/"
style="text-decoration: none; font-size: 10px; margin: 0;"
>
<img src="https://pikwizard.com/pw/medium/870ee9a011538b1aef95967ee98e4cb8.jpg" style="margin: 0; width: 100%;" alt="" />
<p style="font-size: 12px; margin: 0;">PikWizard</p>
</a>
</span>
</span>
Free (free of charge)
Free for personal and commercial use.
Author: Creative Art