- Home >
- Stock Photos >
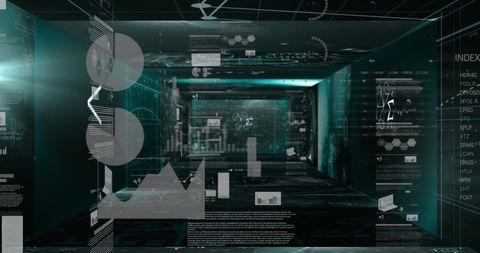
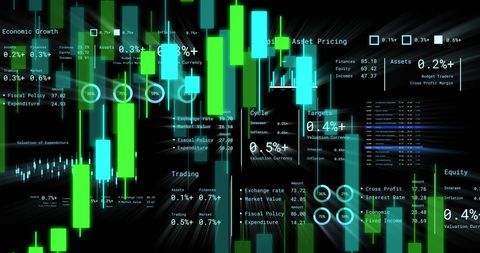
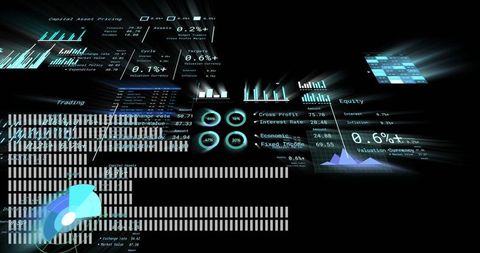
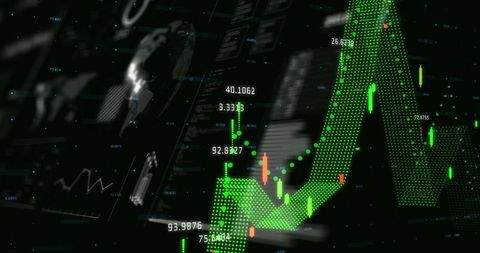
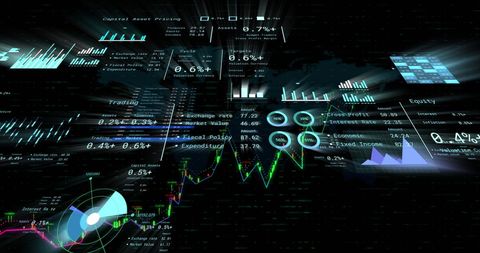
- Futuristic Financial Interface with Data Analytics and Charts
Futuristic Financial Interface with Data Analytics and Charts Image

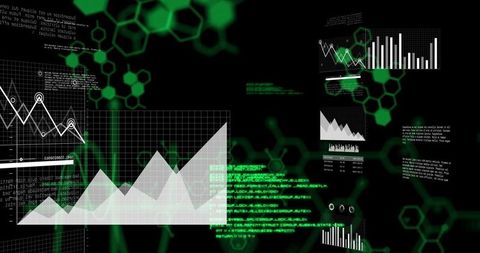
This visualization presents a futuristic display of digital financial dashboards featuring bar graphs and line charts on a green hexagonal grid. These floating panels highlight the integration of advanced technology in analyzing and interpreting complex financial data and market dynamics. Useful for technology articles, financial strategy presentations, AI application demonstrations, and promotional materials for financial technology companies aiming to showcase cutting-edge solutions.

downloads
Tags:
More
Credit Photo
If you would like to credit the Photo, here are some ways you can do so
Text Link
photo Link
<span class="text-link">
<span>
<a target="_blank" href=https://pikwizard.com/photo/futuristic-financial-interface-with-data-analytics-and-charts/31aeb6a716ca086ad51409e94c5acedc/>PikWizard</a>
</span>
</span>
<span class="image-link">
<span
style="margin: 0 0 20px 0; display: inline-block; vertical-align: middle; width: 100%;"
>
<a
target="_blank"
href="https://pikwizard.com/photo/futuristic-financial-interface-with-data-analytics-and-charts/31aeb6a716ca086ad51409e94c5acedc/"
style="text-decoration: none; font-size: 10px; margin: 0;"
>
<img src="https://pikwizard.com/pw/medium/31aeb6a716ca086ad51409e94c5acedc.jpg" style="margin: 0; width: 100%;" alt="" />
<p style="font-size: 12px; margin: 0;">PikWizard</p>
</a>
</span>
</span>
Free (free of charge)
Free for personal and commercial use.
Author: Awesome Content