
- Home >
- Stock Photos >
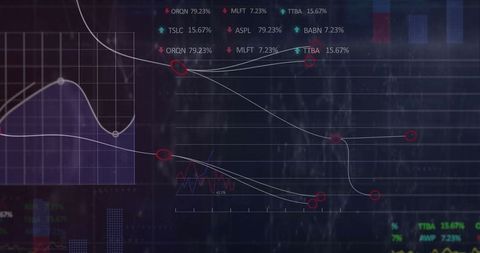
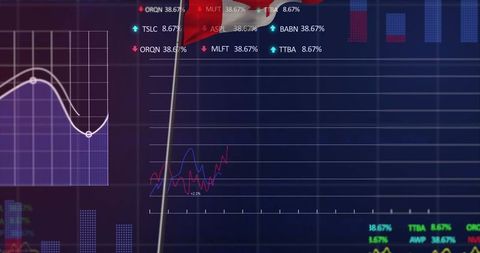
- Futuristic Financial Trading Dashboard with Data Analytics Visualization
Futuristic Financial Trading Dashboard with Data Analytics Visualization Image

A high-tech financial trading dashboard displaying overlaid red and blue lines along with purple bars. Percentages and date metrics illuminate the screen, creating a hub of data analytics crucial for understanding stock performance and market trends. Useful for illustrating finance education materials, enhancing financial blog content, and accompanying business reports on trends and analysis. Ideal for technological and digital innovation contexts within the economic sector.
Powered by 


downloads
Tags:
More
Credit Photo
If you would like to credit the Photo, here are some ways you can do so
Text Link
photo Link
<span class="text-link">
<span>
<a target="_blank" href=https://pikwizard.com/photo/futuristic-financial-trading-dashboard-with-data-analytics-visualization/719f89b8117dc926dd930e2c8b7008f4/>PikWizard</a>
</span>
</span>
<span class="image-link">
<span
style="margin: 0 0 20px 0; display: inline-block; vertical-align: middle; width: 100%;"
>
<a
target="_blank"
href="https://pikwizard.com/photo/futuristic-financial-trading-dashboard-with-data-analytics-visualization/719f89b8117dc926dd930e2c8b7008f4/"
style="text-decoration: none; font-size: 10px; margin: 0;"
>
<img src="https://pikwizard.com/pw/medium/719f89b8117dc926dd930e2c8b7008f4.jpg" style="margin: 0; width: 100%;" alt="" />
<p style="font-size: 12px; margin: 0;">PikWizard</p>
</a>
</span>
</span>
Free (free of charge)
Free for personal and commercial use.
Author: Authentic Images
Similar Free Stock Images

Premium


Premium


AI

Premium


Premium


Premium

Premium


Premium

Premium

Premium

Premium


Premium


Premium


Premium


Premium

Premium

Premium


Premium

Premium


Premium


Premium


Premium


Premium


Premium


Premium


Premium

Explore More Free Stock Images