
- Home >
- Stock Photos >
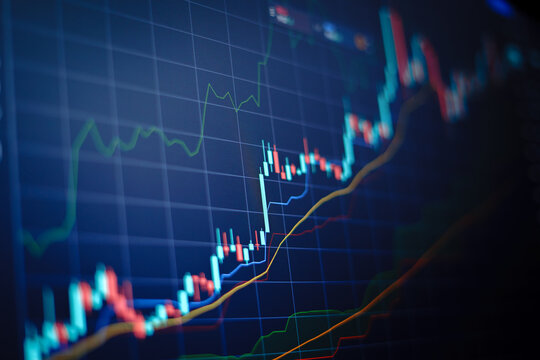
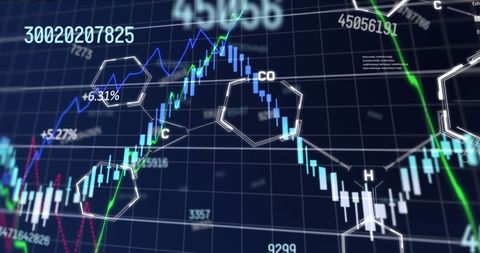
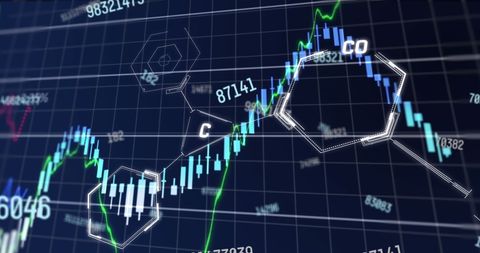
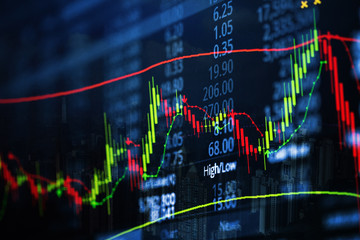
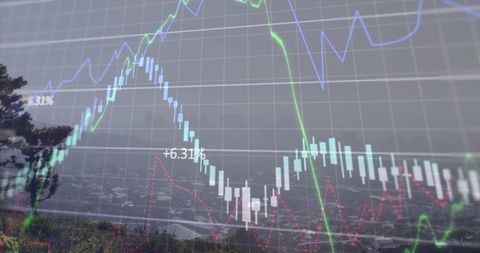
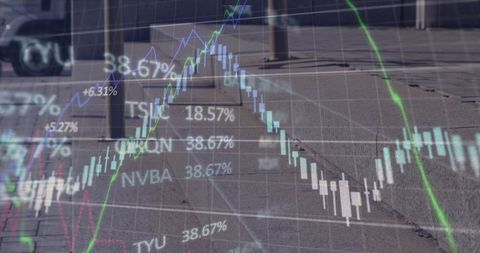
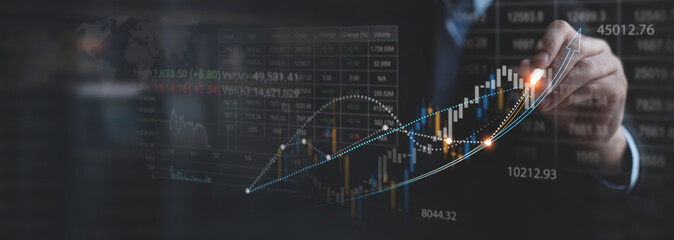
- Futuristic Financial Trading Graph and Data Visualization
Futuristic Financial Trading Graph and Data Visualization Image

Lines and numbers form intricate financial trading graph, emphasizing global commerce trends. Useful for illustrating economic analysis, trading technologies, data tracking in business contexts, and briefs in fintech sectors.
Powered by 


downloads
Tags:
More
Credit Photo
If you would like to credit the Photo, here are some ways you can do so
Text Link
photo Link
<span class="text-link">
<span>
<a target="_blank" href=https://pikwizard.com/photo/futuristic-financial-trading-graph-and-data-visualization/62ef9beb2cc1be68964f957fc0bbe36e/>PikWizard</a>
</span>
</span>
<span class="image-link">
<span
style="margin: 0 0 20px 0; display: inline-block; vertical-align: middle; width: 100%;"
>
<a
target="_blank"
href="https://pikwizard.com/photo/futuristic-financial-trading-graph-and-data-visualization/62ef9beb2cc1be68964f957fc0bbe36e/"
style="text-decoration: none; font-size: 10px; margin: 0;"
>
<img src="https://pikwizard.com/pw/medium/62ef9beb2cc1be68964f957fc0bbe36e.jpg" style="margin: 0; width: 100%;" alt="" />
<p style="font-size: 12px; margin: 0;">PikWizard</p>
</a>
</span>
</span>
Free (free of charge)
Free for personal and commercial use.
Author: Awesome Content
Similar Free Stock Images

Premium


Premium


Premium


Premium


Premium


Premium


Premium


Premium

Premium


Premium


Premium


Premium
Premium

Premium


Premium


Premium


Premium


Premium
Premium


Premium


Premium


Premium


Premium

Premium


Premium


Explore More Free Stock Images