- Home >
- Stock Photos >
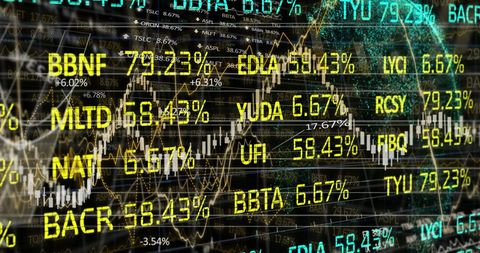
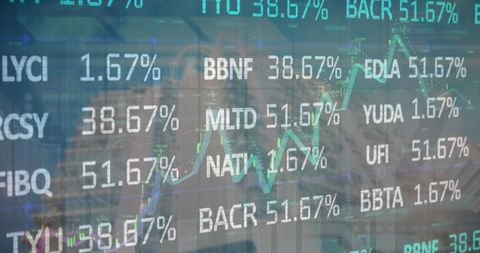
- Futuristic Financial Trading Hub with Streaming Data
Futuristic Financial Trading Hub with Streaming Data Image

Futuristic visualization of a financial trading hub, showing streaming data such as stock prices, tickers, and chart curves across a 3D grid backdrop. Ideal for use in articles, presentations, or websites related to finance, technology, stock trading, and digital innovation. Can be leveraged in projects showcasing the potential of modern financial platforms and immersive data display environments.
Powered by  - Get 15% off with code: PIKWIZARD15


2
downloads
downloads
Tags:
More
Credit Photo
If you would like to credit the Photo, here are some ways you can do so
Text Link
photo Link
<span class="text-link">
<span>
<a target="_blank" href=https://pikwizard.com/photo/futuristic-financial-trading-hub-with-streaming-data/1960f68ee994c30db56effb87d08e5b9/>PikWizard</a>
</span>
</span>
<span class="image-link">
<span
style="margin: 0 0 20px 0; display: inline-block; vertical-align: middle; width: 100%;"
>
<a
target="_blank"
href="https://pikwizard.com/photo/futuristic-financial-trading-hub-with-streaming-data/1960f68ee994c30db56effb87d08e5b9/"
style="text-decoration: none; font-size: 10px; margin: 0;"
>
<img src="https://pikwizard.com/pw/medium/1960f68ee994c30db56effb87d08e5b9.jpg" style="margin: 0; width: 100%;" alt="" />
<p style="font-size: 12px; margin: 0;">PikWizard</p>
</a>
</span>
</span>
Free (free of charge)
Free for personal and commercial use.
Author: People Creations
Similar Free Stock Images
Loading...

Premium


Premium

Premium


Premium

Premium


Premium


Premium

Premium


Premium

Premium


Premium

Premium


Premium

Premium

Premium

Premium


Premium


Premium


Premium


Premium


Premium


Premium


Premium


Premium

Premium