- Home >
- Stock Photos >
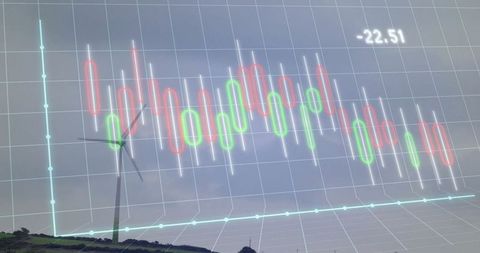
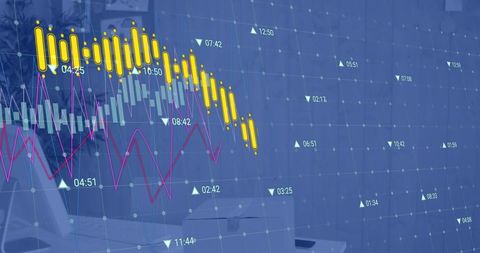
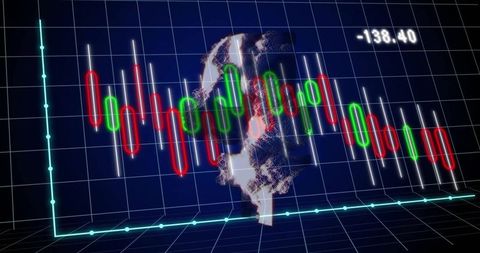
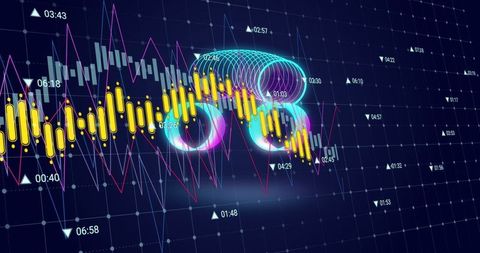
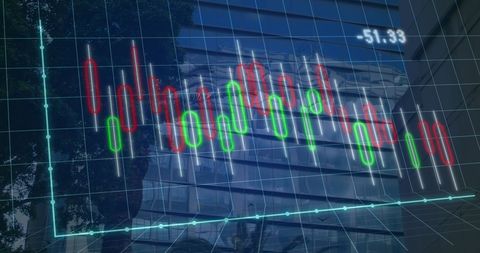
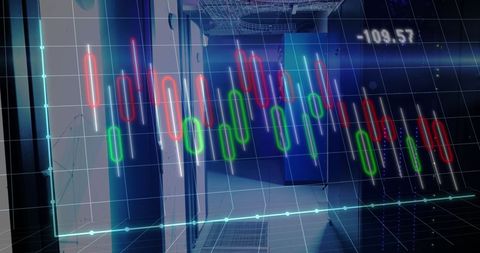
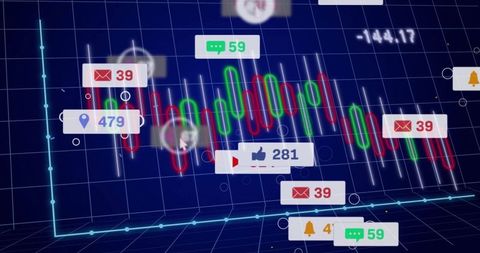
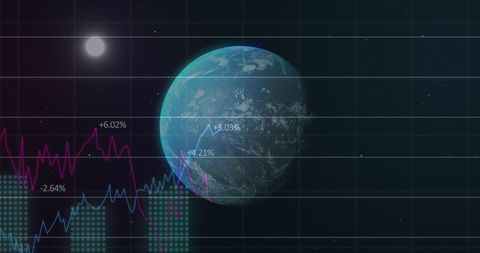
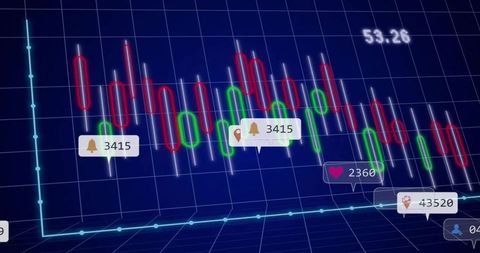
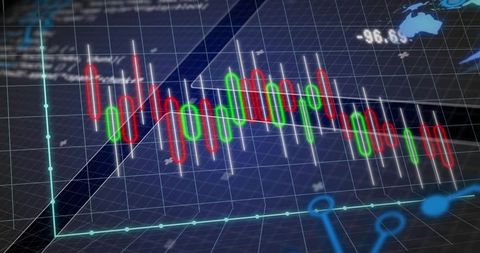
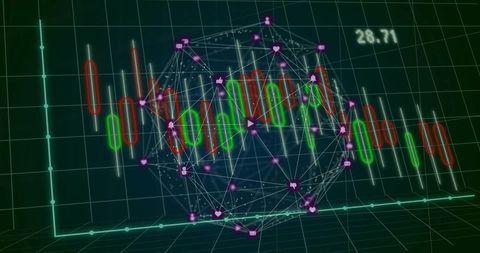
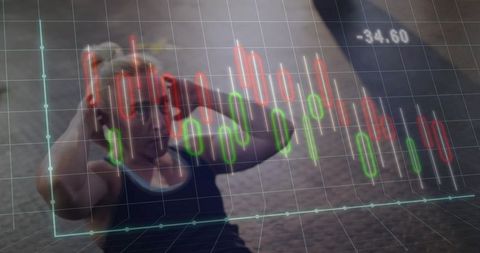
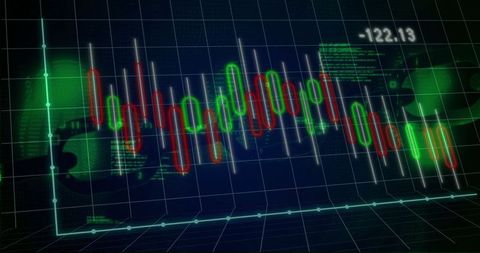
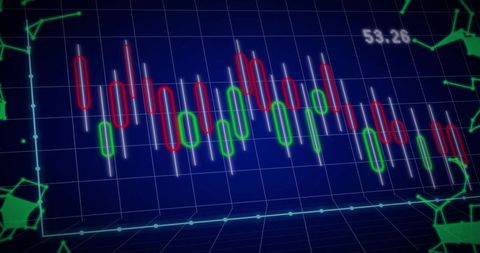
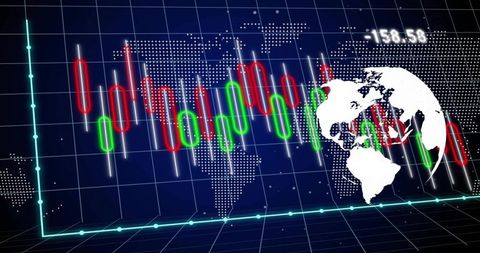
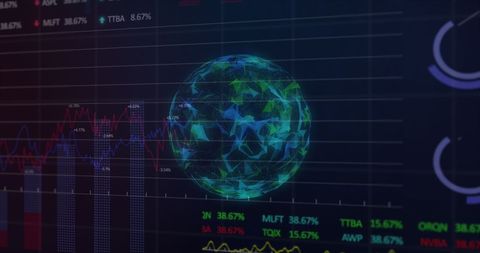
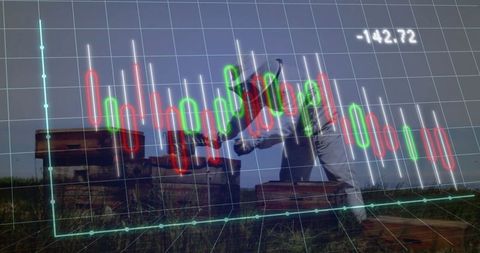
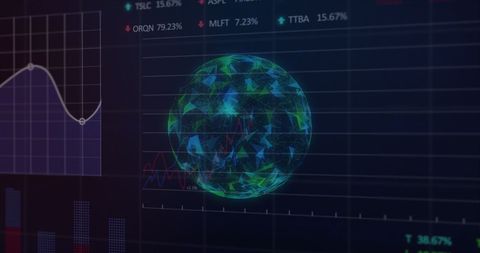
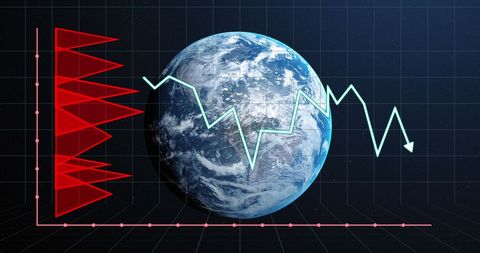
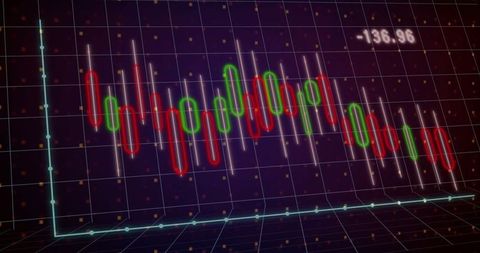
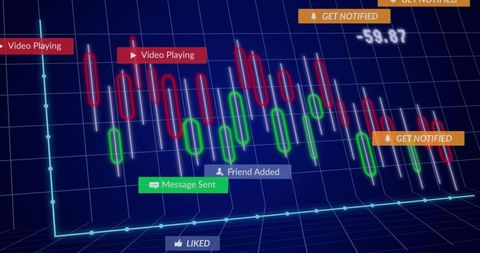
- Futuristic Global Financial Data Visualization on Rotating Earth Globe
Futuristic Global Financial Data Visualization on Rotating Earth Globe Image
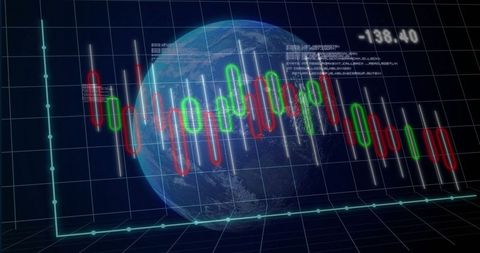
Illustrates the intersection of global economy and advanced analytics with rotating Earth and financial candlestick bars on dark digital grid. Ideal for use in technology, finance, or economics presentations and publications by highlighting the fusion of data analytics and global trends through a cutting-edge digital display.

downloads
Tags:
More
Credit Photo
If you would like to credit the Photo, here are some ways you can do so
Text Link
photo Link
<span class="text-link">
<span>
<a target="_blank" href=https://pikwizard.com/photo/futuristic-global-financial-data-visualization-on-rotating-earth-globe/a9e2258b4e43c9ebe7851d6363786c3d/>PikWizard</a>
</span>
</span>
<span class="image-link">
<span
style="margin: 0 0 20px 0; display: inline-block; vertical-align: middle; width: 100%;"
>
<a
target="_blank"
href="https://pikwizard.com/photo/futuristic-global-financial-data-visualization-on-rotating-earth-globe/a9e2258b4e43c9ebe7851d6363786c3d/"
style="text-decoration: none; font-size: 10px; margin: 0;"
>
<img src="https://pikwizard.com/pw/medium/a9e2258b4e43c9ebe7851d6363786c3d.jpg" style="margin: 0; width: 100%;" alt="" />
<p style="font-size: 12px; margin: 0;">PikWizard</p>
</a>
</span>
</span>
Free (free of charge)
Free for personal and commercial use.
Author: Awesome Content