
- Home >
- Stock Photos >
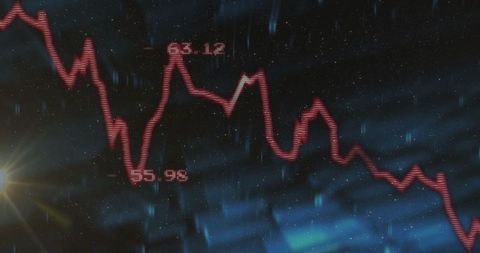
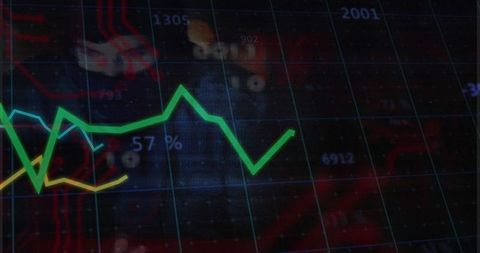
- Futuristic Glowing Line Graph with Numeric Data
Futuristic Glowing Line Graph with Numeric Data Image

This vibrant illustration depicts a neon line graph fluctuating amid blurred numeric background, symbolizing financial market dynamics and data analytics. Suitable for presentations on finance tech innovation, illustrating market trends in modern digital landscapes, or enhancing content related to investment growth and economic predictions.
Powered by 


downloads
Tags:
More
Credit Photo
If you would like to credit the Photo, here are some ways you can do so
Text Link
photo Link
<span class="text-link">
<span>
<a target="_blank" href=https://pikwizard.com/photo/futuristic-glowing-line-graph-with-numeric-data/7afe0682864e6a738ae32569ef40b8b5/>PikWizard</a>
</span>
</span>
<span class="image-link">
<span
style="margin: 0 0 20px 0; display: inline-block; vertical-align: middle; width: 100%;"
>
<a
target="_blank"
href="https://pikwizard.com/photo/futuristic-glowing-line-graph-with-numeric-data/7afe0682864e6a738ae32569ef40b8b5/"
style="text-decoration: none; font-size: 10px; margin: 0;"
>
<img src="https://pikwizard.com/pw/medium/7afe0682864e6a738ae32569ef40b8b5.jpg" style="margin: 0; width: 100%;" alt="" />
<p style="font-size: 12px; margin: 0;">PikWizard</p>
</a>
</span>
</span>
Free (free of charge)
Free for personal and commercial use.
Author: Creative Art
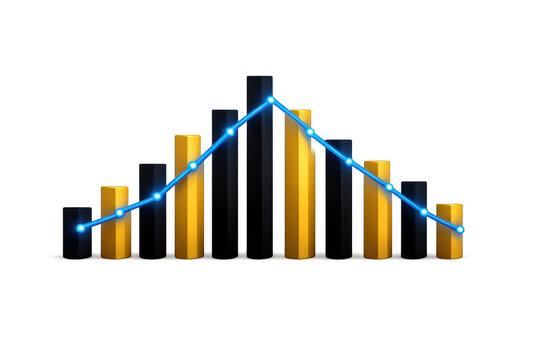
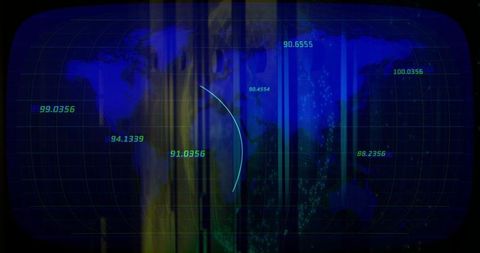
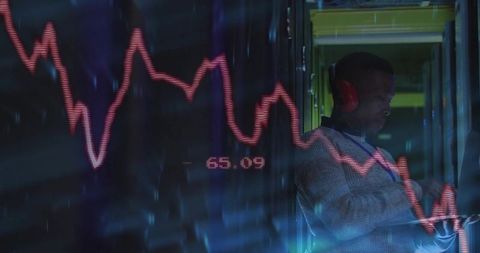
Similar Free Stock Images

Premium


Premium

Premium


Premium


Premium

Premium


Premium


Premium


Premium


Premium

Premium

Premium


Premium


Premium

Premium

Premium

Premium


Premium


Premium

Premium


Premium


Premium


Premium


Premium


Premium


Explore More Free Stock Images