- Home >
- Stock Photos >
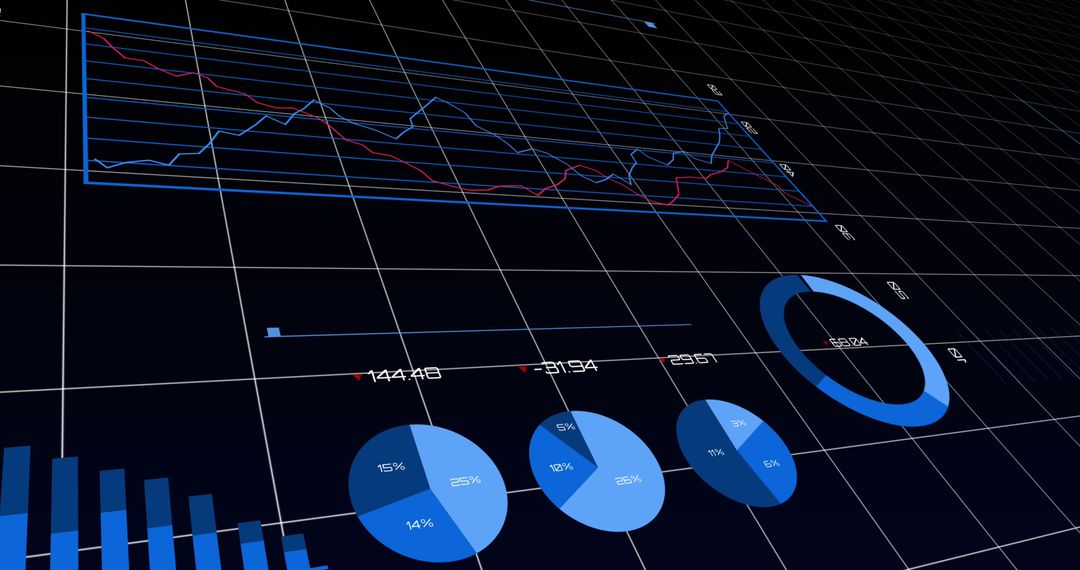
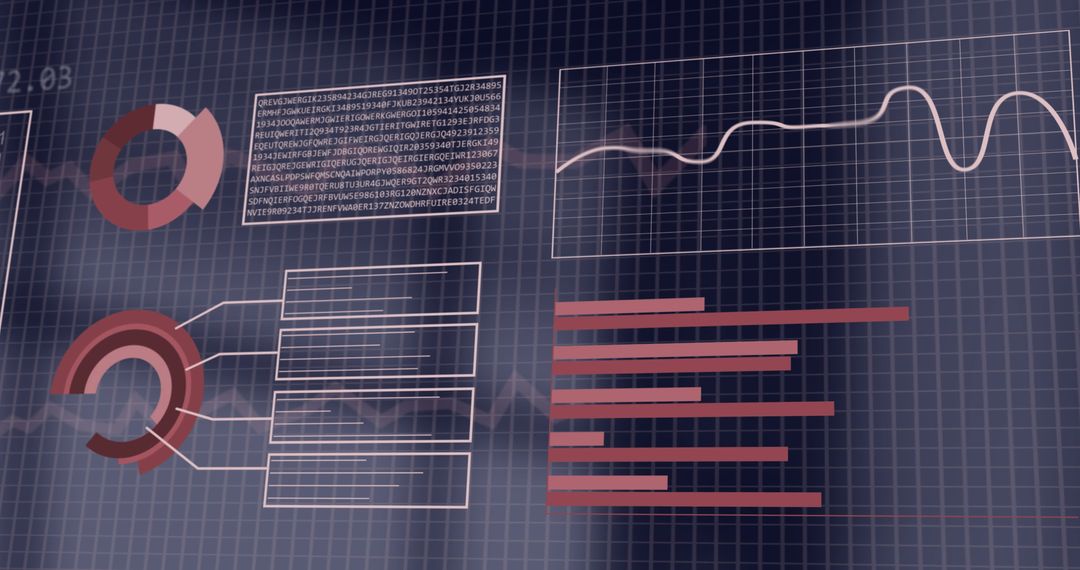
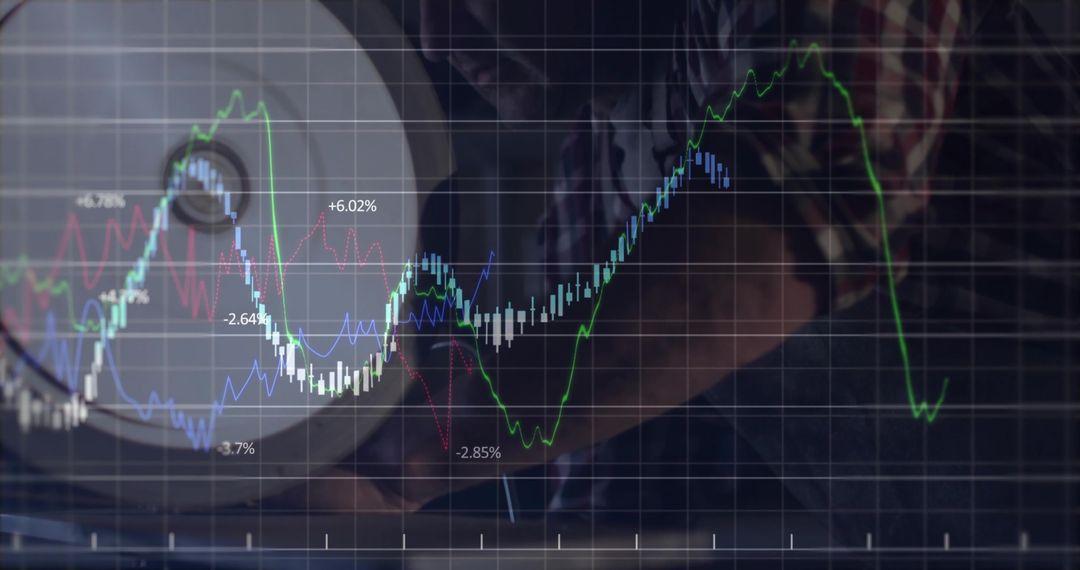
- Futuristic Graphs and Holographic Display for Data Analysis
Futuristic Graphs and Holographic Display for Data Analysis Image
Futuristic holographic visualization embodies concept of modern data analysis through computer screen or interface. Use in presentation showing technological advances in dashboard design. Suitable for business reports, marketing materials demonstrating innovation potential or forward-thinking approach. Engaging background for video content focusing on data science, analytics, or high-tech storytelling themes. Adds science fiction flair for broader creative use in digital novels or gaming previews.
Powered by  - Get 15% off with code: PIKWIZARD15


0
downloads
downloads
Tags:
More
Credit Photo
If you would like to credit the Photo, here are some ways you can do so
Text Link
photo Link
<span class="text-link">
<span>
<a target="_blank" href=https://pikwizard.com/photo/futuristic-graphs-and-holographic-display-for-data-analysis/17cac67272743ebf26fda58695bdb383/>PikWizard</a>
</span>
</span>
<span class="image-link">
<span
style="margin: 0 0 20px 0; display: inline-block; vertical-align: middle; width: 100%;"
>
<a
target="_blank"
href="https://pikwizard.com/photo/futuristic-graphs-and-holographic-display-for-data-analysis/17cac67272743ebf26fda58695bdb383/"
style="text-decoration: none; font-size: 10px; margin: 0;"
>
<img src="https://pikwizard.com/pw/medium/17cac67272743ebf26fda58695bdb383.jpg" style="margin: 0; width: 100%;" alt="" />
<p style="font-size: 12px; margin: 0;">PikWizard</p>
</a>
</span>
</span>
Free (free of charge)
Free for personal and commercial use.
Author: Authentic Images
Similar Free Stock Images

Premium


Premium


Premium


Premium


Premium


Premium


Premium


Premium


Premium


Premium


Premium


Premium


Premium


Premium


Premium

Premium


Premium


Premium


Premium


Premium


Premium


Premium


Premium


Premium