- Home >
- Stock Photos >
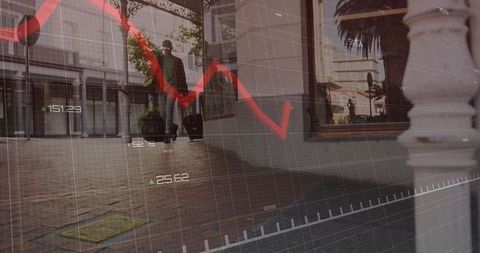
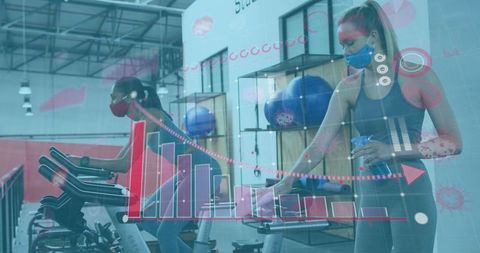
- Futuristic Graphs Overlaid on Cyclist Symbolize Covid-19 Impact
Futuristic Graphs Overlaid on Cyclist Symbolize Covid-19 Impact Image

The merging of data graphs and a cyclist personifies Covid-19's influence on urban life through statistics and digital technology. This creative juxtaposition represents analysis of pandemic progression and its effects on daily routines. Useful for presentations or articles discussing the technological monitoring and management of the crisis, or exploring how Covid-19 altered urban environments. Perfect for editors or designers focusing on technology and healthcare sectors amidst a pandemic.
Powered by  - Get 15% off with code: PIKWIZARD15


2
downloads
downloads
Tags:
More
Credit Photo
If you would like to credit the Photo, here are some ways you can do so
Text Link
photo Link
<span class="text-link">
<span>
<a target="_blank" href=https://pikwizard.com/photo/futuristic-graphs-overlaid-on-cyclist-symbolize-covid-19-impact/7f8c283b71979742e1cd13cb18b89b31/>PikWizard</a>
</span>
</span>
<span class="image-link">
<span
style="margin: 0 0 20px 0; display: inline-block; vertical-align: middle; width: 100%;"
>
<a
target="_blank"
href="https://pikwizard.com/photo/futuristic-graphs-overlaid-on-cyclist-symbolize-covid-19-impact/7f8c283b71979742e1cd13cb18b89b31/"
style="text-decoration: none; font-size: 10px; margin: 0;"
>
<img src="https://pikwizard.com/pw/medium/7f8c283b71979742e1cd13cb18b89b31.jpg" style="margin: 0; width: 100%;" alt="" />
<p style="font-size: 12px; margin: 0;">PikWizard</p>
</a>
</span>
</span>
Free (free of charge)
Free for personal and commercial use.
Author: People Creations
Similar Free Stock Images
Loading...


Premium


Premium


Premium


Premium


Premium


Premium


Premium


Premium


Premium

Premium


Premium


Premium

Premium

Premium


Premium

Premium


Premium


Premium


Premium


Premium


Premium


Premium


Premium


Premium


Premium