- Home >
- Stock Photos >
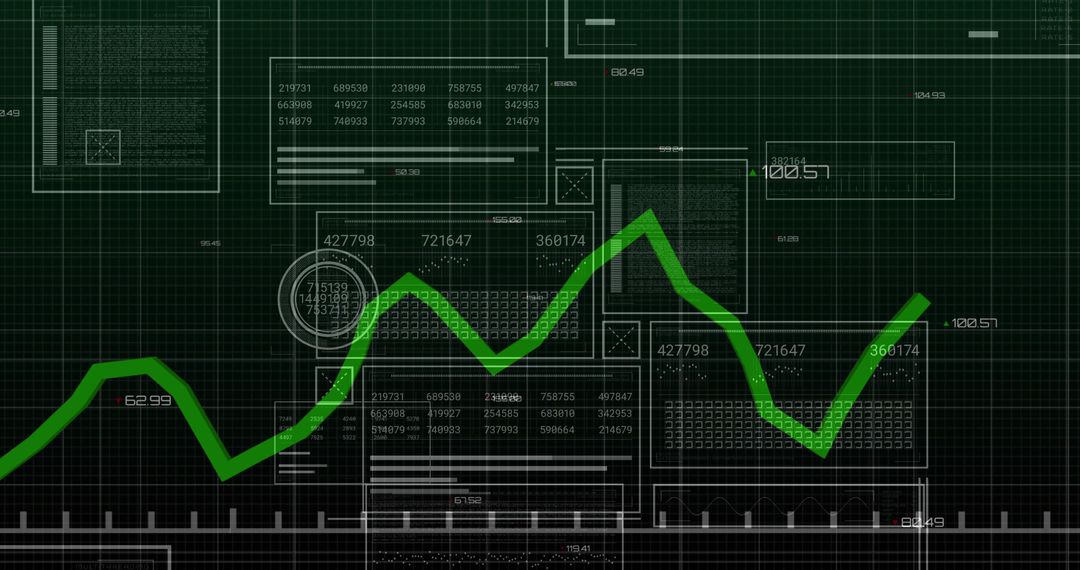
- Futuristic Green Line Graph on Digital Display Panel
Futuristic Green Line Graph on Digital Display Panel Image

Futuristic green line graph illustrating data trends on a digital display panel. Neon elements create an engaging visual experience ideal for technology presentations, business reports, or educational materials focusing on data analysis or market trends. Use this image to showcase growth, tech advancements, or immersive data-drivenness.
Powered by  - Get 15% off with code: PIKWIZARD15


0
downloads
downloads
Tags:
More
Credit Photo
If you would like to credit the Photo, here are some ways you can do so
Text Link
photo Link
<span class="text-link">
<span>
<a target="_blank" href=https://pikwizard.com/photo/futuristic-green-line-graph-on-digital-display-panel/18258baeea5894af350a26d65bd03334/>PikWizard</a>
</span>
</span>
<span class="image-link">
<span
style="margin: 0 0 20px 0; display: inline-block; vertical-align: middle; width: 100%;"
>
<a
target="_blank"
href="https://pikwizard.com/photo/futuristic-green-line-graph-on-digital-display-panel/18258baeea5894af350a26d65bd03334/"
style="text-decoration: none; font-size: 10px; margin: 0;"
>
<img src="https://pikwizard.com/pw/medium/18258baeea5894af350a26d65bd03334.jpg" style="margin: 0; width: 100%;" alt="" />
<p style="font-size: 12px; margin: 0;">PikWizard</p>
</a>
</span>
</span>
Free (free of charge)
Free for personal and commercial use.
Author: Authentic Images
Similar Free Stock Images

Premium


Premium


Premium


Premium


Premium


Premium


Premium


Premium