- Home >
- Stock Photos >
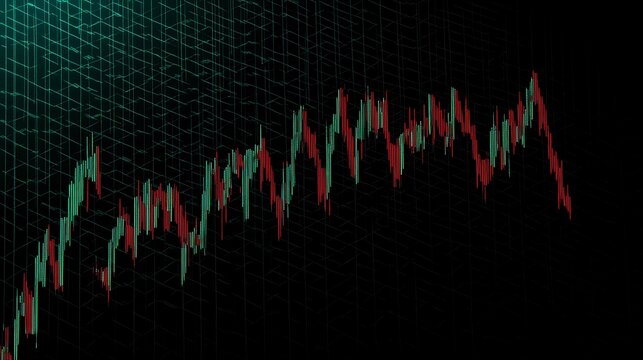
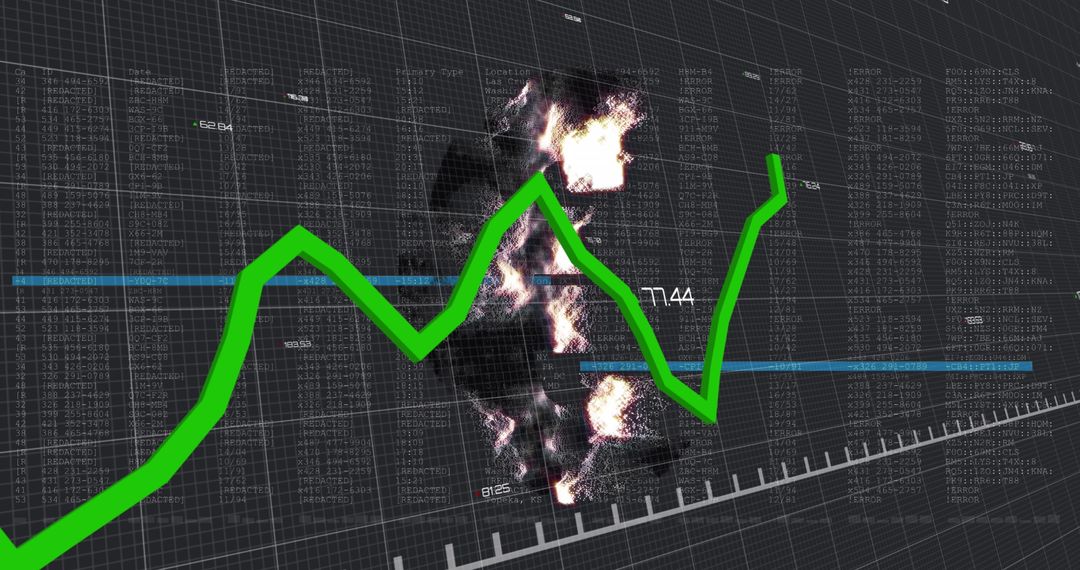
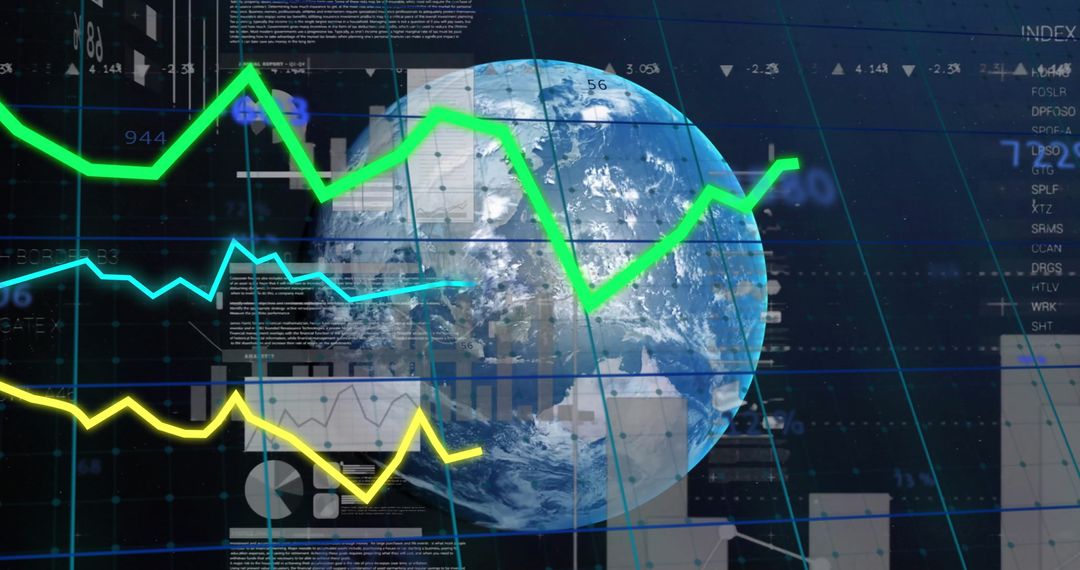
- Futuristic Green Line Graph Over Global Data Charts
Futuristic Green Line Graph Over Global Data Charts Image

Futuristic design with a green line graph overlaid on a grid pattern and various data charts. Represents global business trends in a digital landscape, making it perfect for illustrating financial reports or articles on technological advancements.
Powered by 


2
downloads
downloads
Tags:
More
Credit Photo
If you would like to credit the Photo, here are some ways you can do so
Text Link
photo Link
<span class="text-link">
<span>
<a target="_blank" href=https://pikwizard.com/photo/futuristic-green-line-graph-over-global-data-charts/26f6193b51dc22aeee075426e98927bd/>PikWizard</a>
</span>
</span>
<span class="image-link">
<span
style="margin: 0 0 20px 0; display: inline-block; vertical-align: middle; width: 100%;"
>
<a
target="_blank"
href="https://pikwizard.com/photo/futuristic-green-line-graph-over-global-data-charts/26f6193b51dc22aeee075426e98927bd/"
style="text-decoration: none; font-size: 10px; margin: 0;"
>
<img src="https://pikwizard.com/pw/medium/26f6193b51dc22aeee075426e98927bd.jpg" style="margin: 0; width: 100%;" alt="" />
<p style="font-size: 12px; margin: 0;">PikWizard</p>
</a>
</span>
</span>
Free (free of charge)
Free for personal and commercial use.
Author: Creative Art
Similar Free Stock Images

Premium


Premium


Premium


Premium


Premium


Premium


Premium


Premium


Premium


Premium


Premium


Premium


Premium


Premium


Premium


Premium


Premium


Premium


Premium


Premium


Premium


Premium


Premium


Premium