- Home >
- Stock Photos >
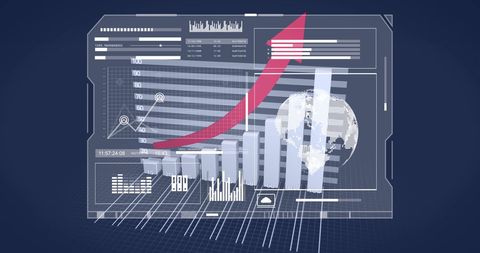
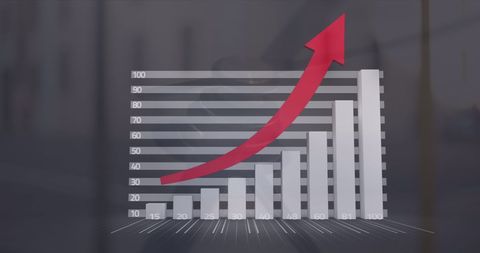
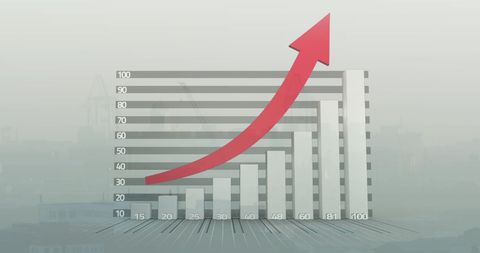
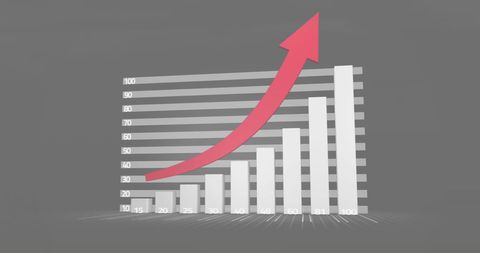
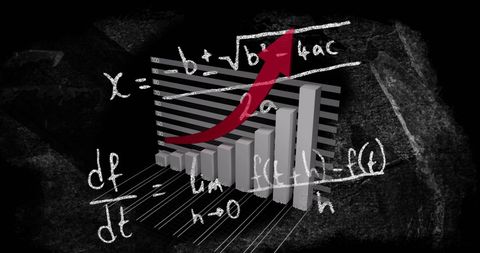
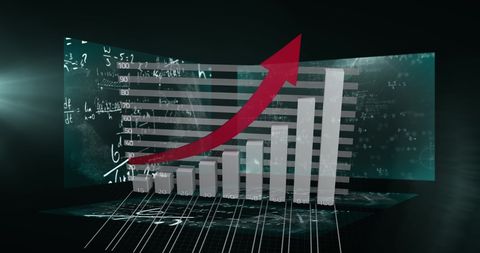
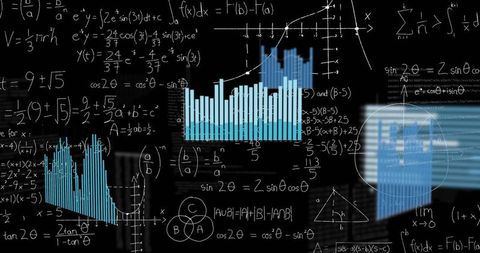
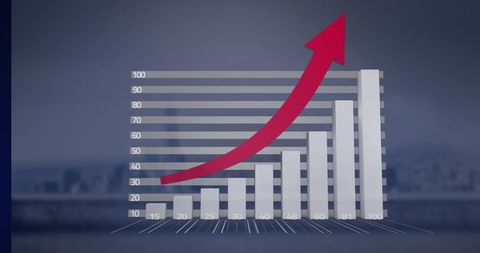
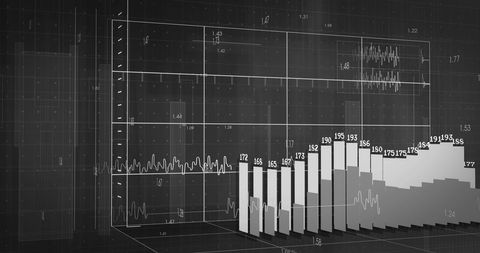
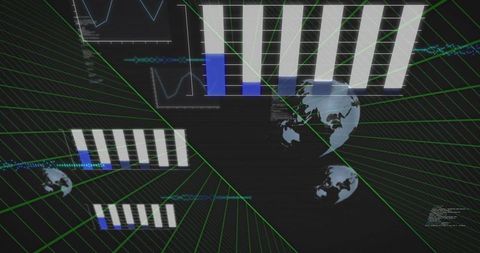
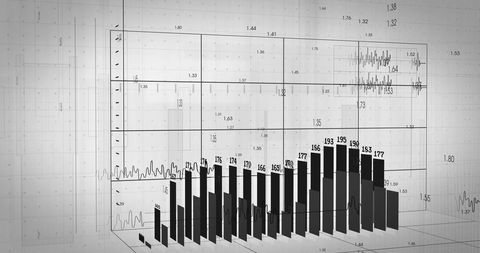
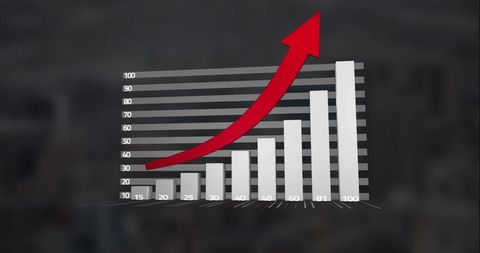
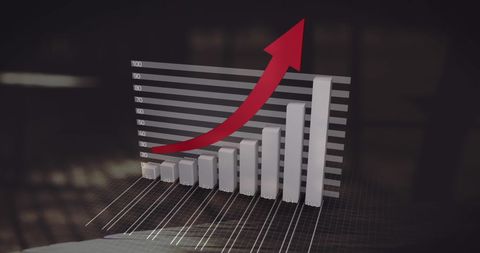
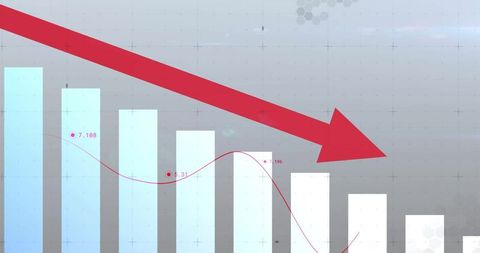
- Futuristic Growing Bar Graph with Math Equations
Futuristic Growing Bar Graph with Math Equations Image
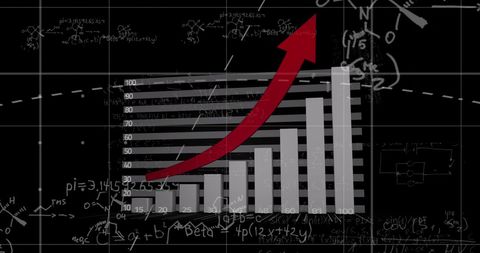
Featuring a digital bar graph with a rising red arrow overlays complex mathematical equations. The geometric design has a futuristic vibe, emphasizing data analysis and technology development. Suitable for illustrating concepts related to analytics, education in mathematics, data processing techniques, and technology advancements.

downloads
Tags:
More
Credit Photo
If you would like to credit the Photo, here are some ways you can do so
Text Link
photo Link
<span class="text-link">
<span>
<a target="_blank" href=https://pikwizard.com/photo/futuristic-growing-bar-graph-with-math-equations/d26f1f371b4c1268e9acb9f115d36d88/>PikWizard</a>
</span>
</span>
<span class="image-link">
<span
style="margin: 0 0 20px 0; display: inline-block; vertical-align: middle; width: 100%;"
>
<a
target="_blank"
href="https://pikwizard.com/photo/futuristic-growing-bar-graph-with-math-equations/d26f1f371b4c1268e9acb9f115d36d88/"
style="text-decoration: none; font-size: 10px; margin: 0;"
>
<img src="https://pikwizard.com/pw/medium/d26f1f371b4c1268e9acb9f115d36d88.jpg" style="margin: 0; width: 100%;" alt="" />
<p style="font-size: 12px; margin: 0;">PikWizard</p>
</a>
</span>
</span>
Free (free of charge)
Free for personal and commercial use.
Author: Authentic Images