- Home >
- Stock Photos >
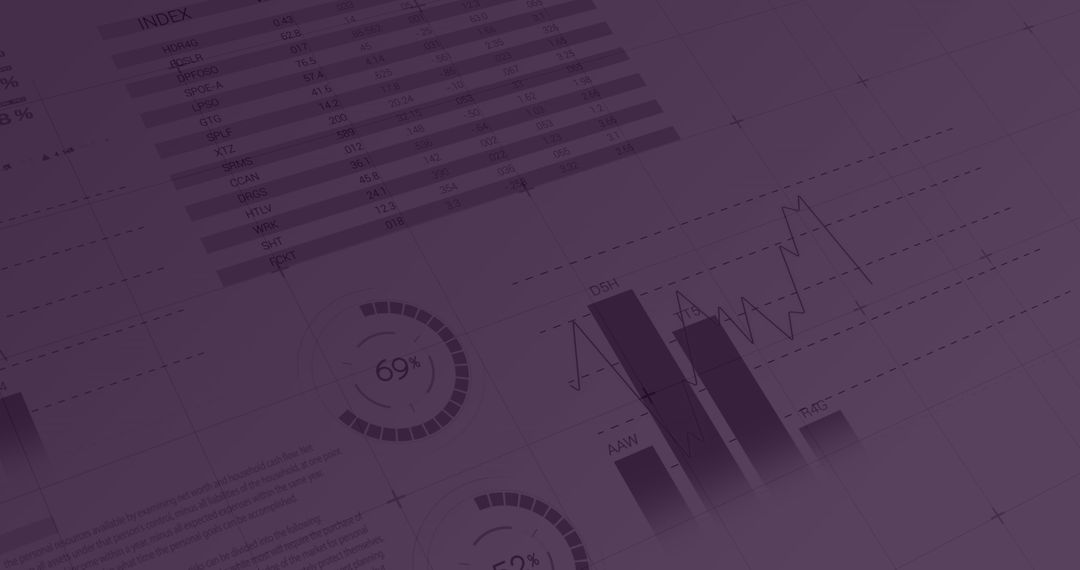
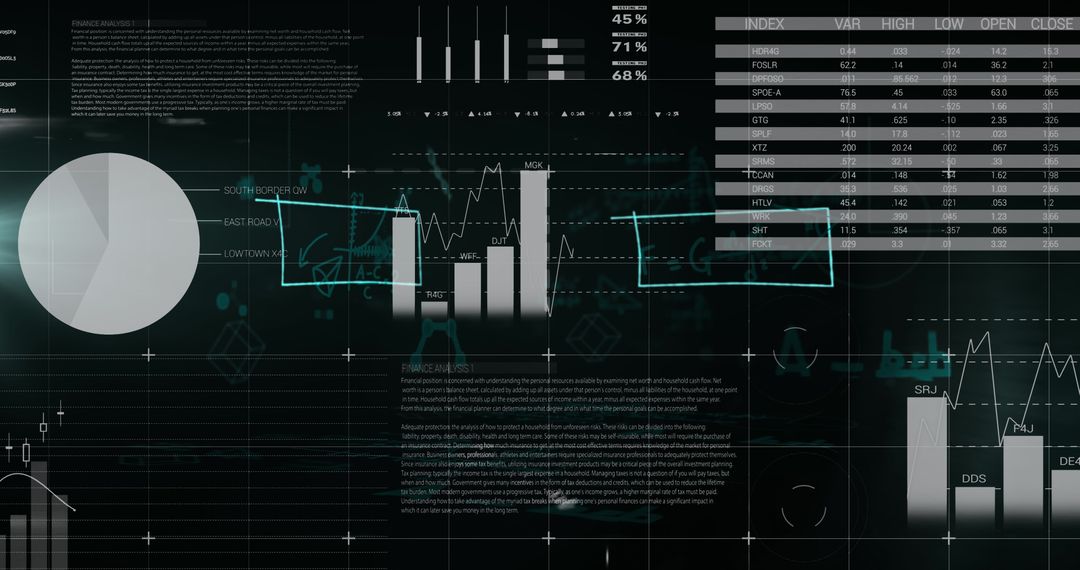
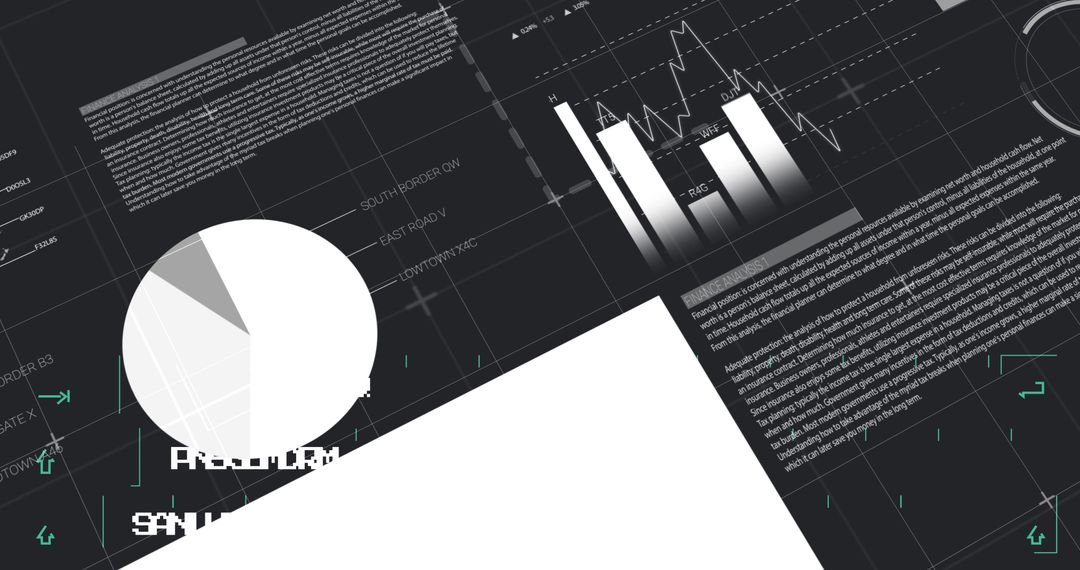
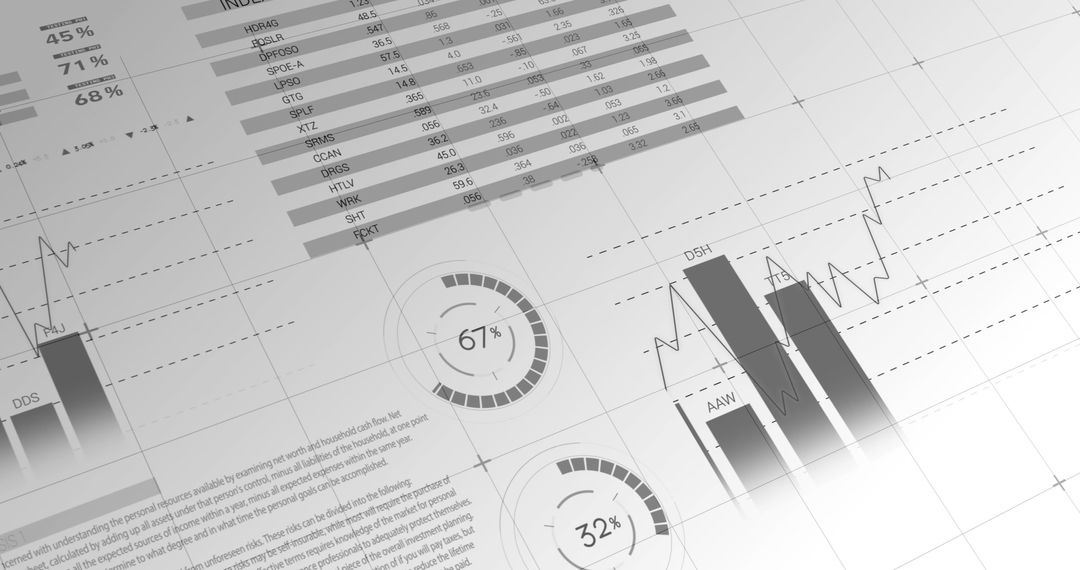
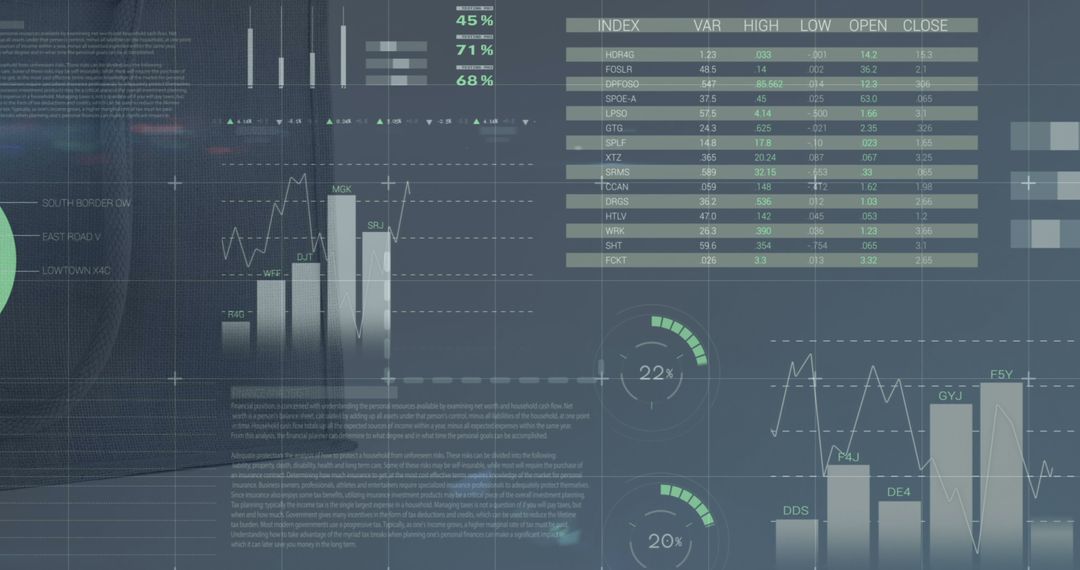
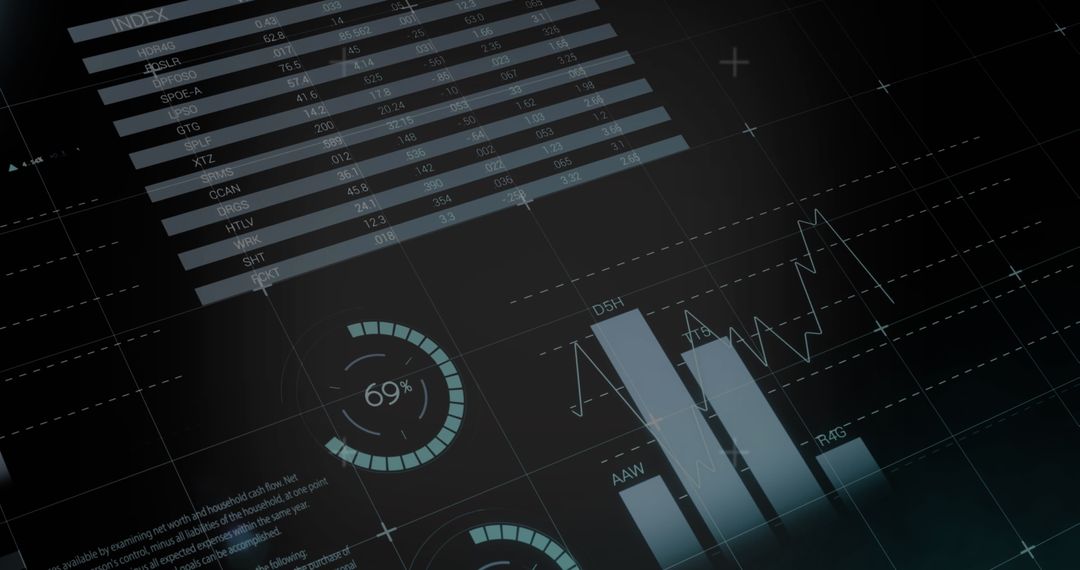
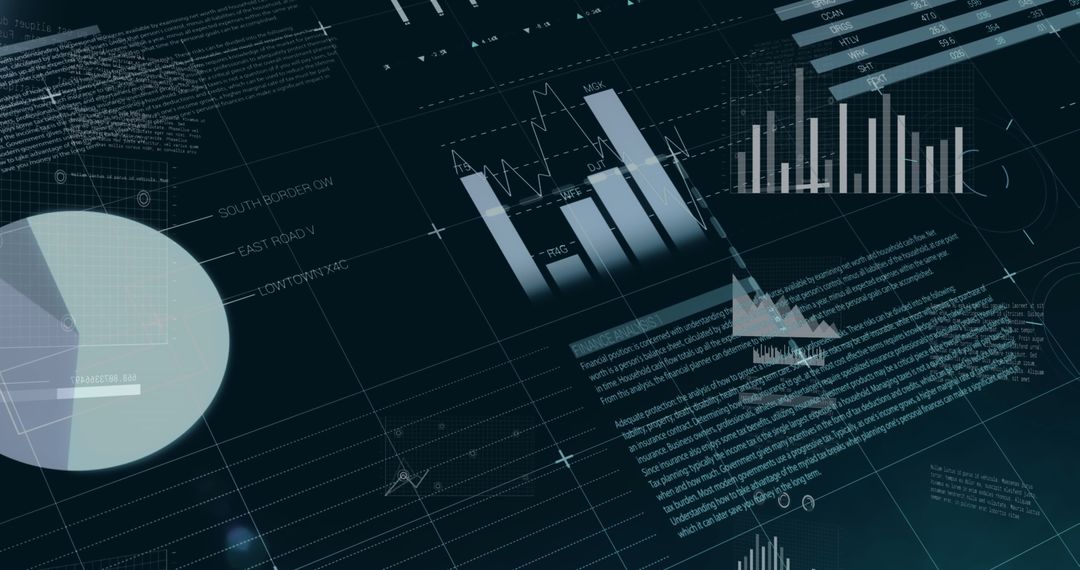
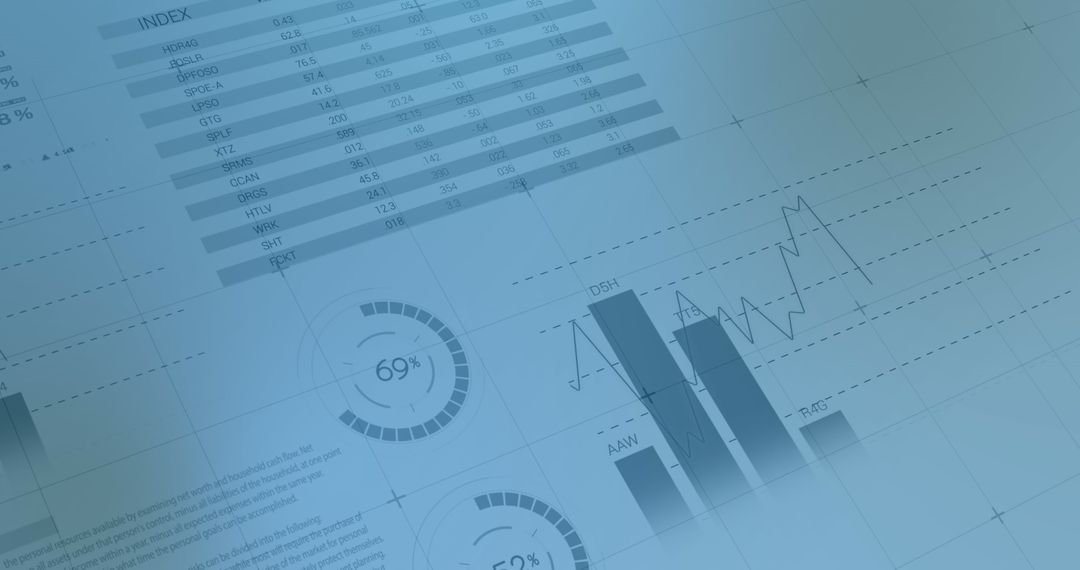
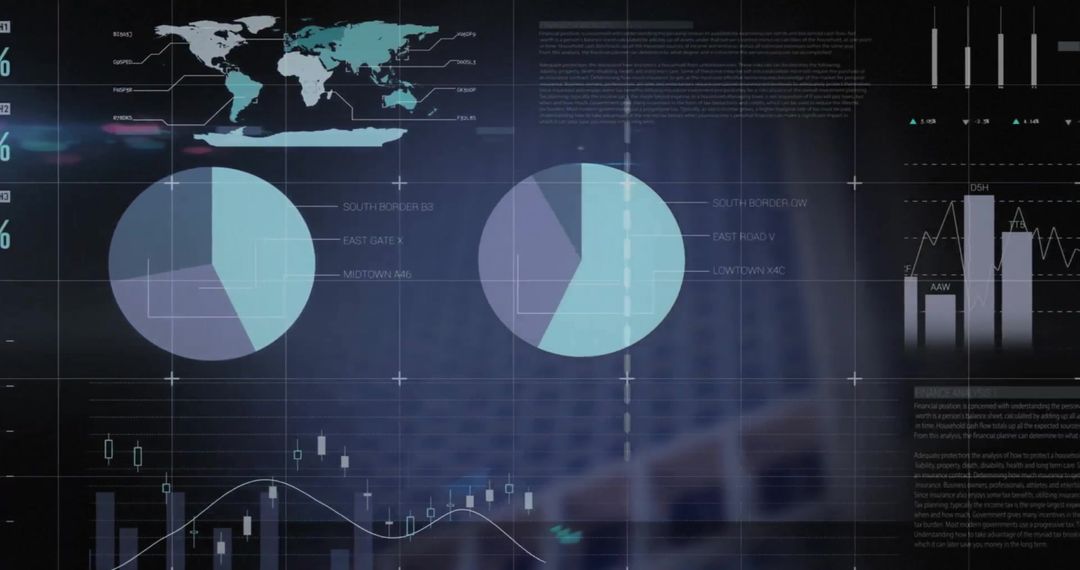
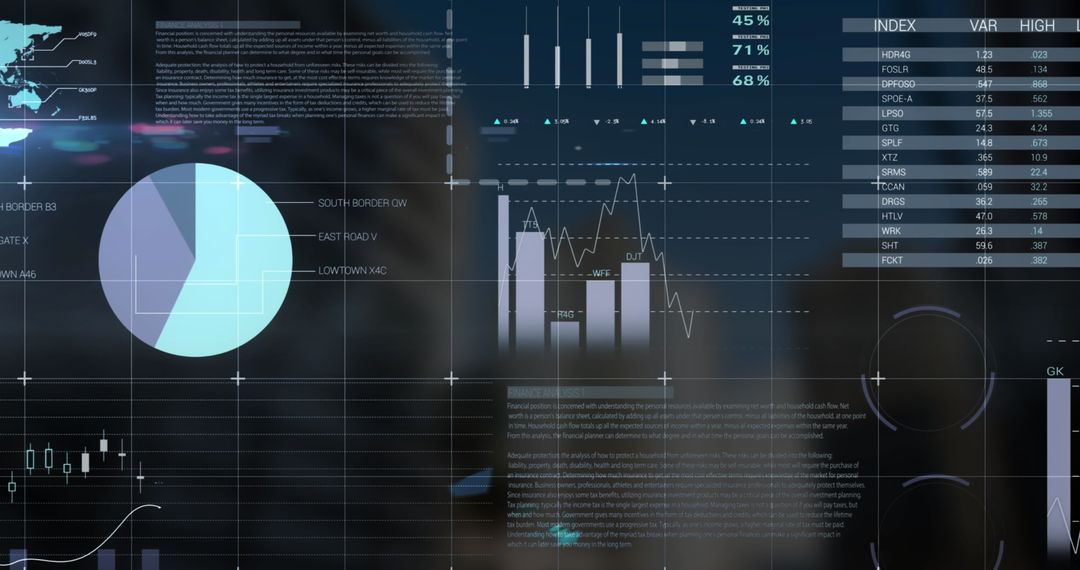
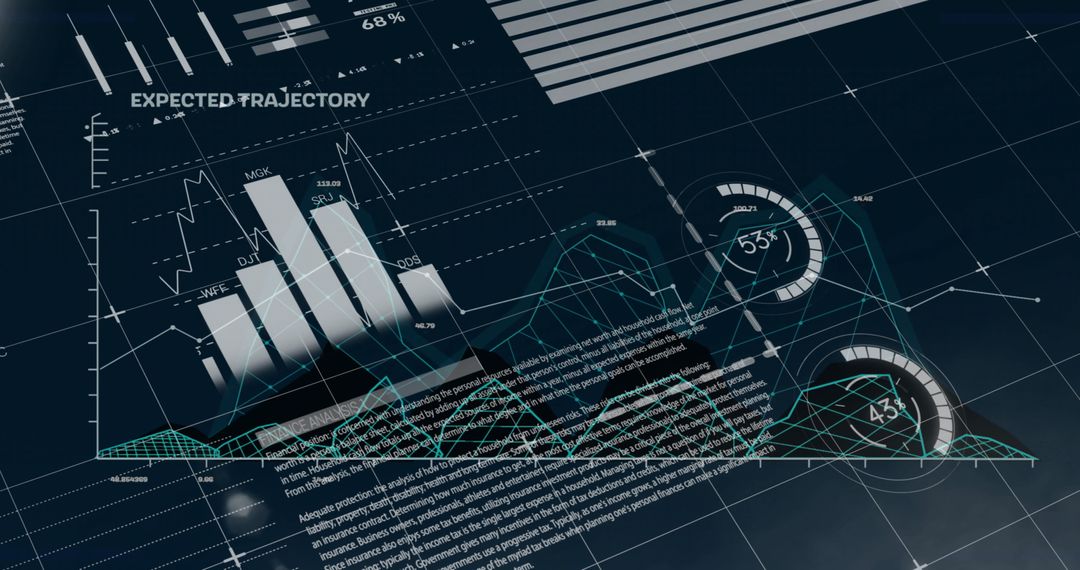
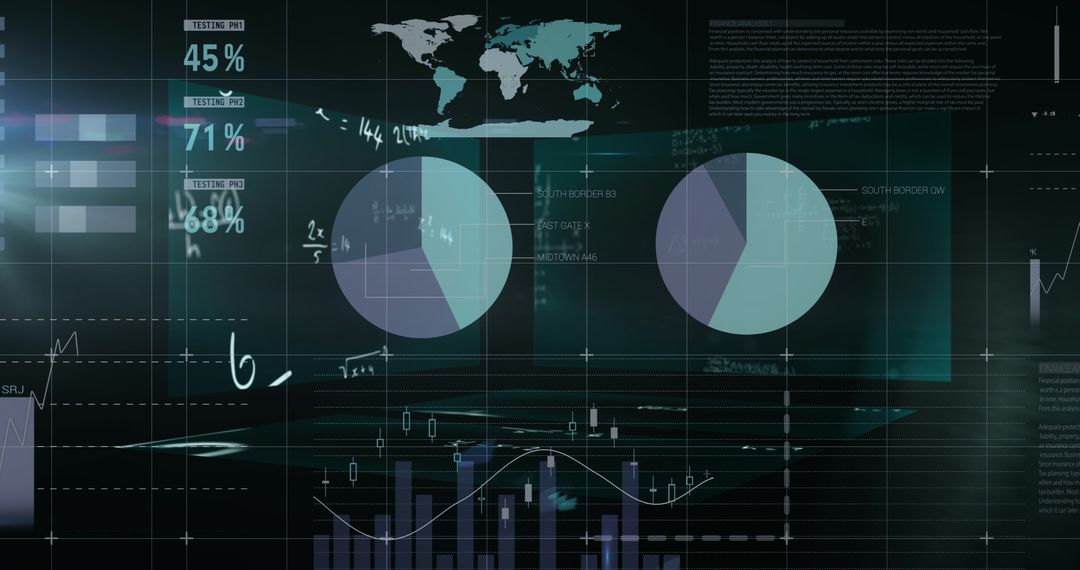
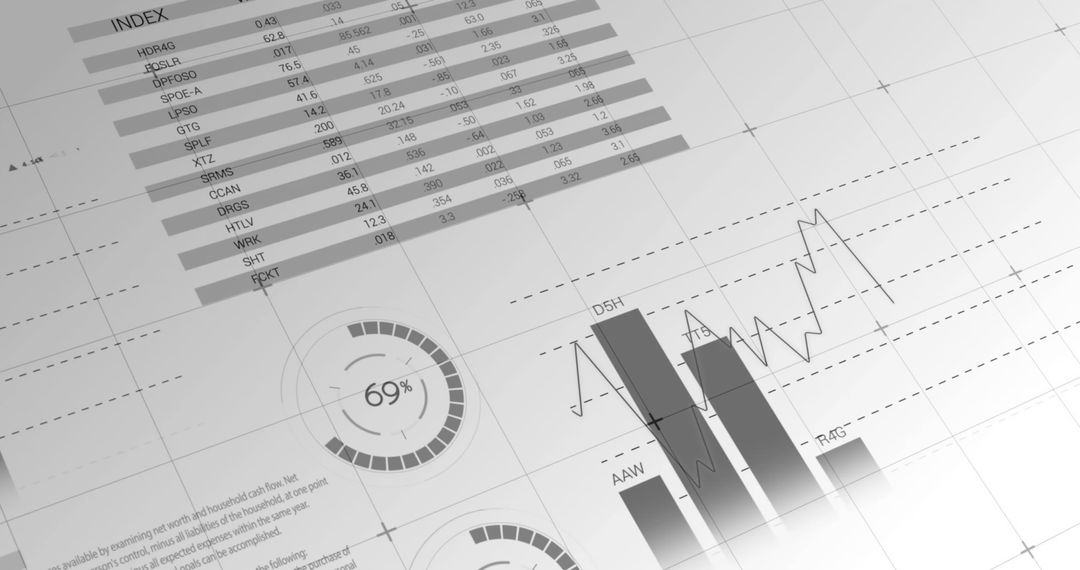
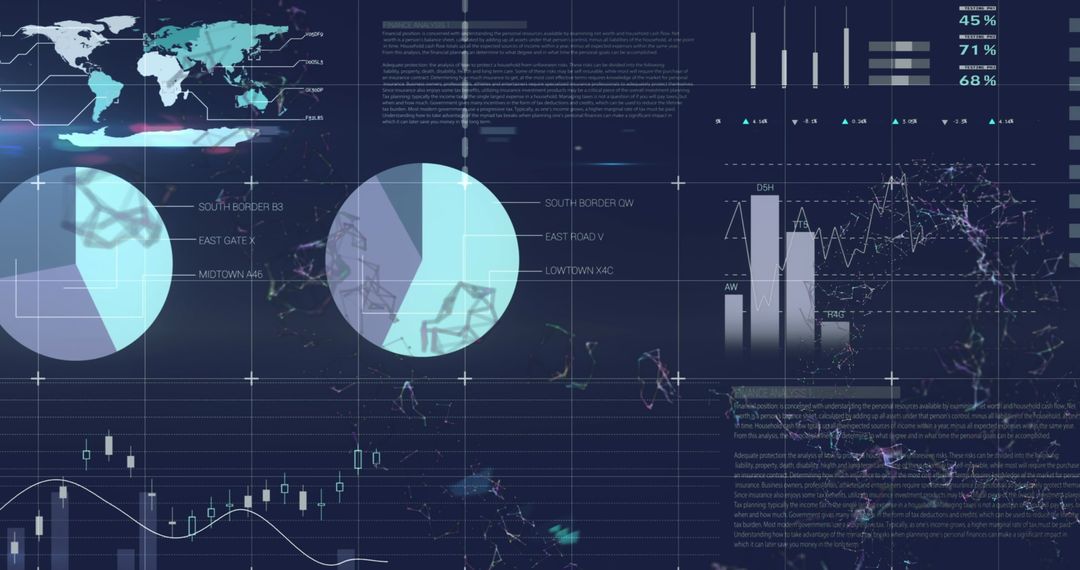
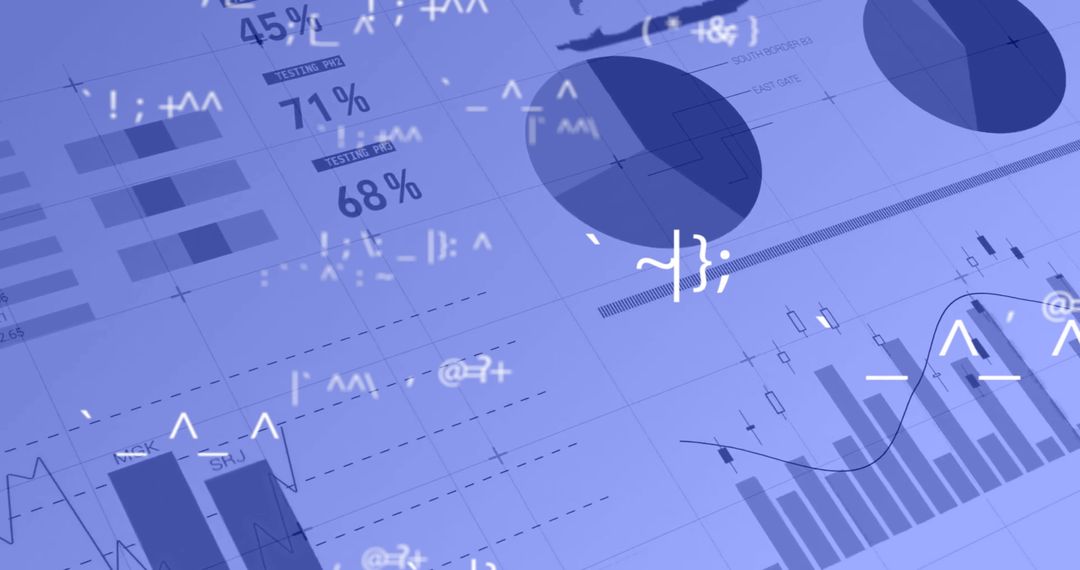
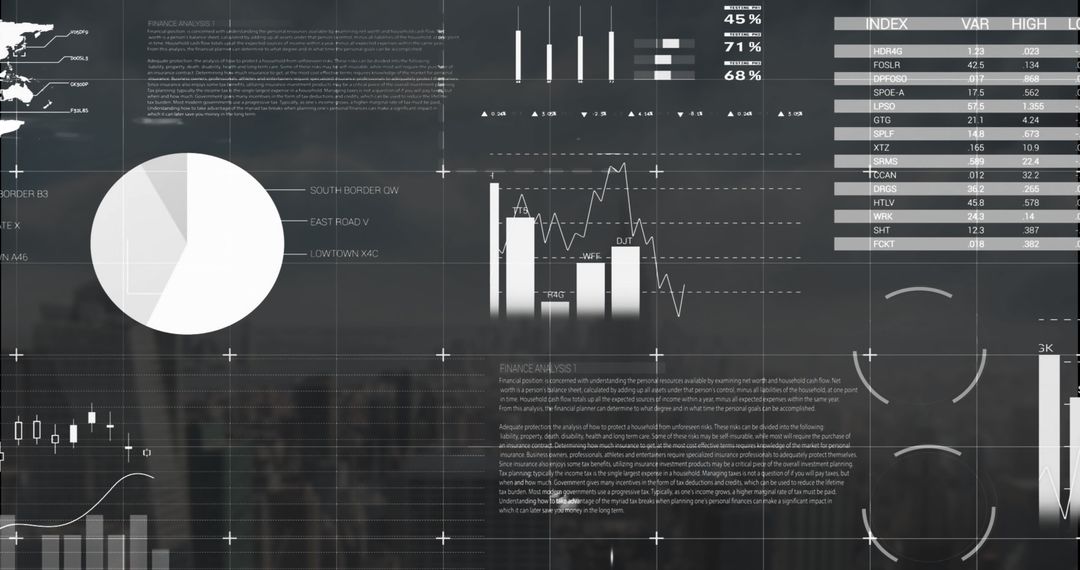
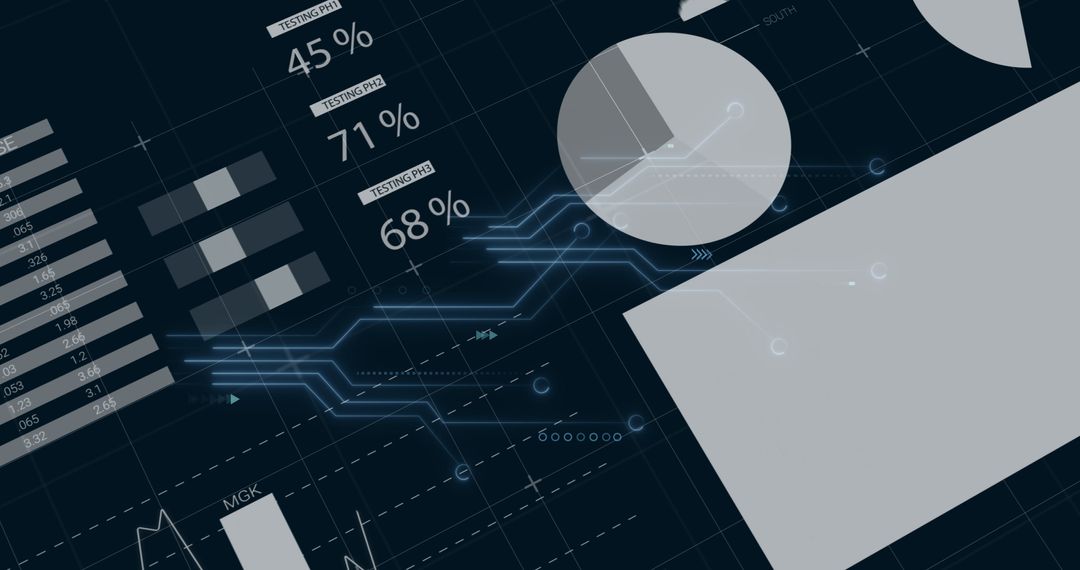
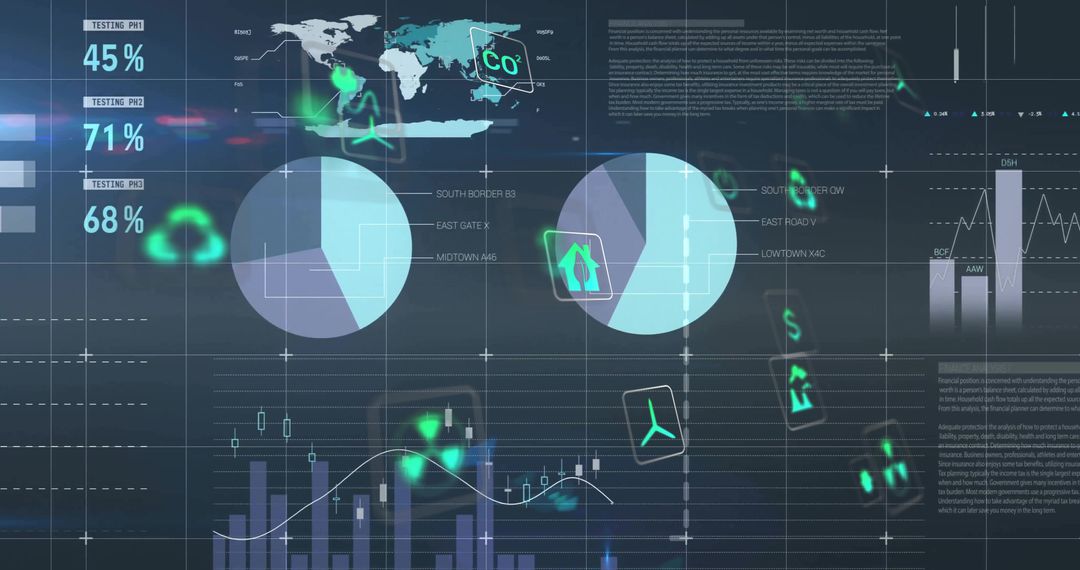
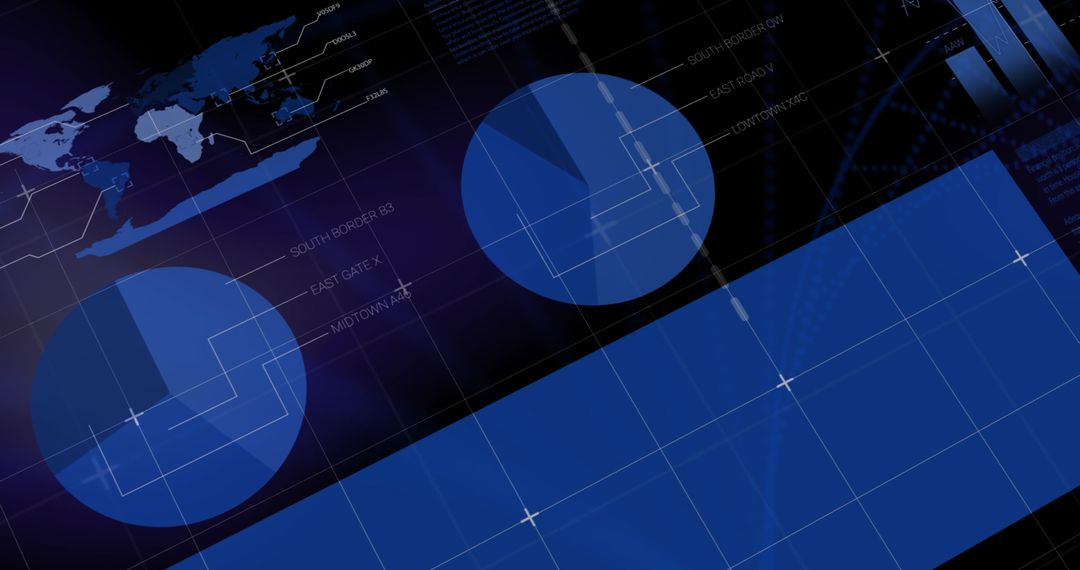
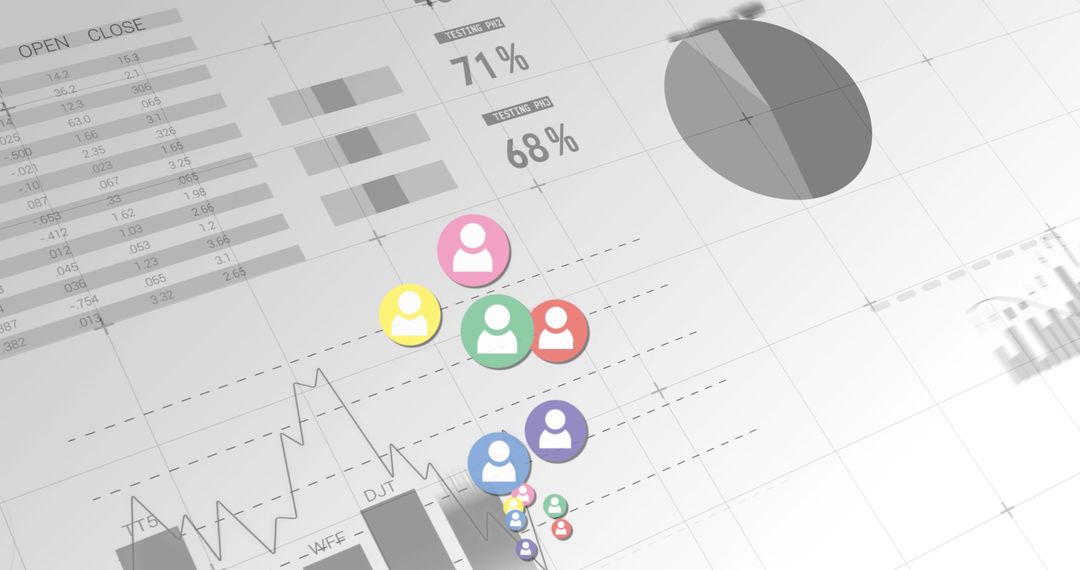
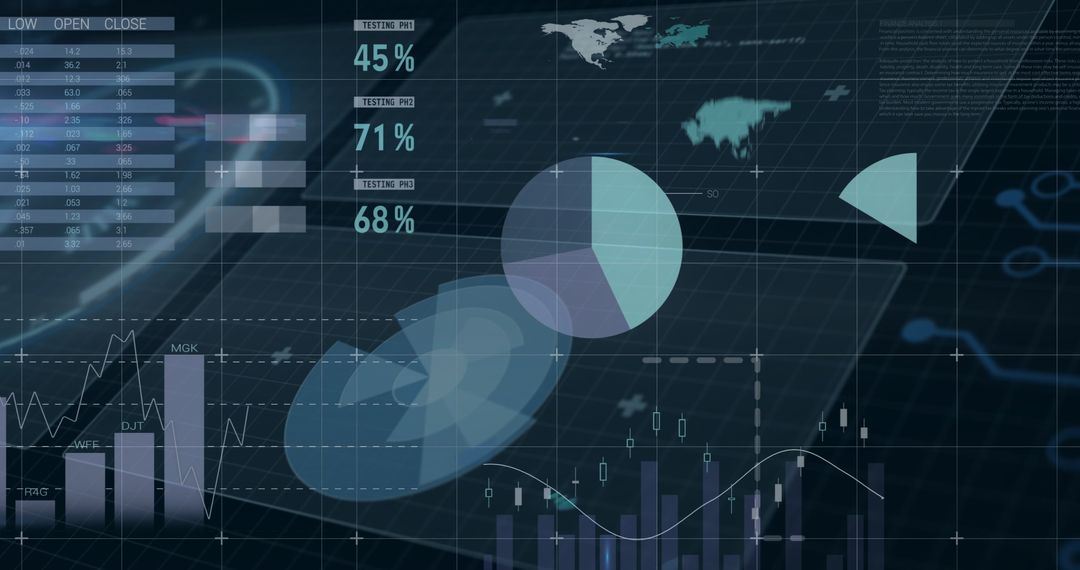
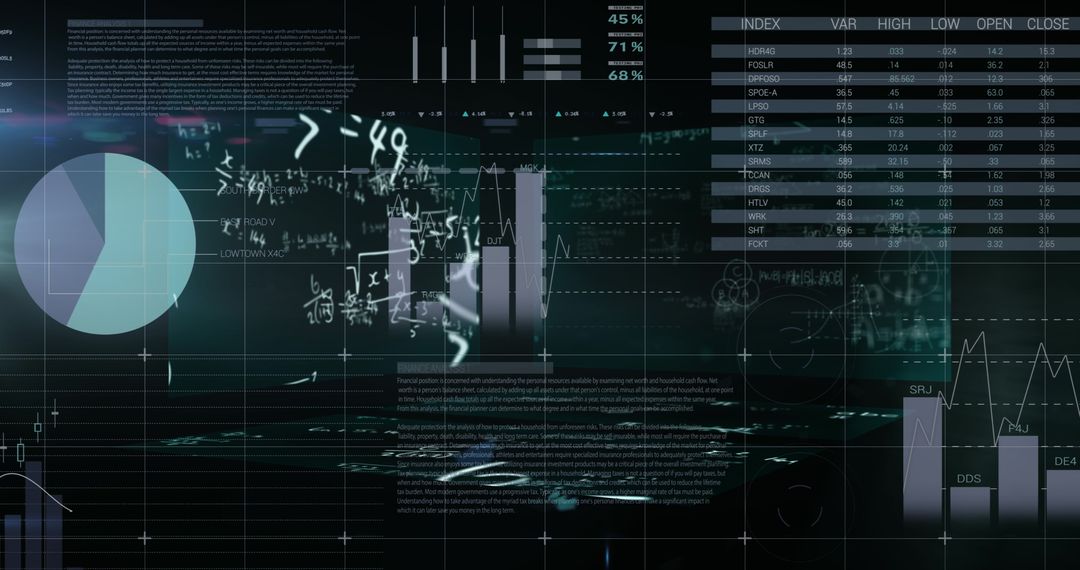
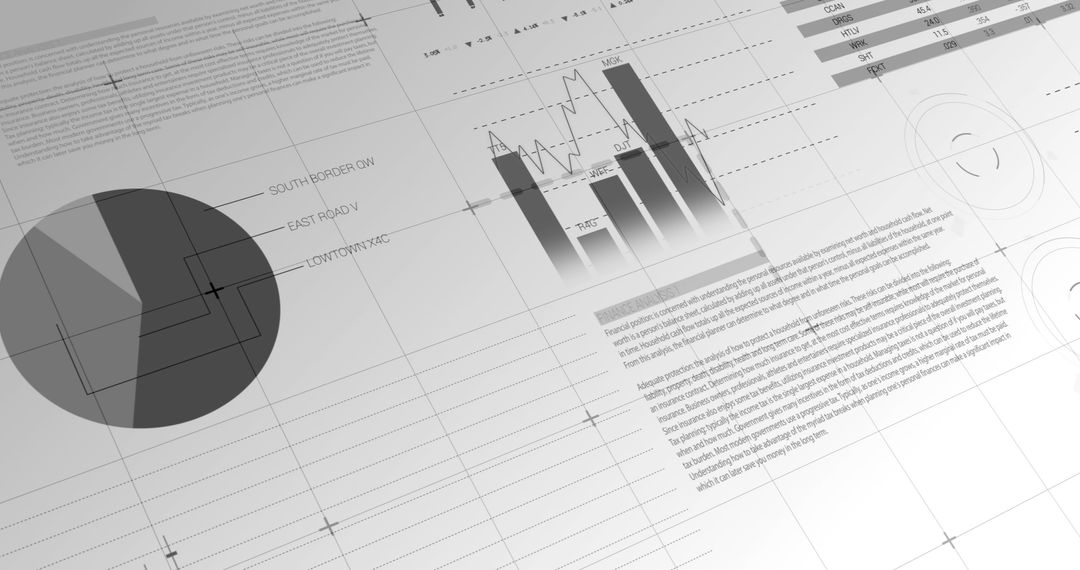
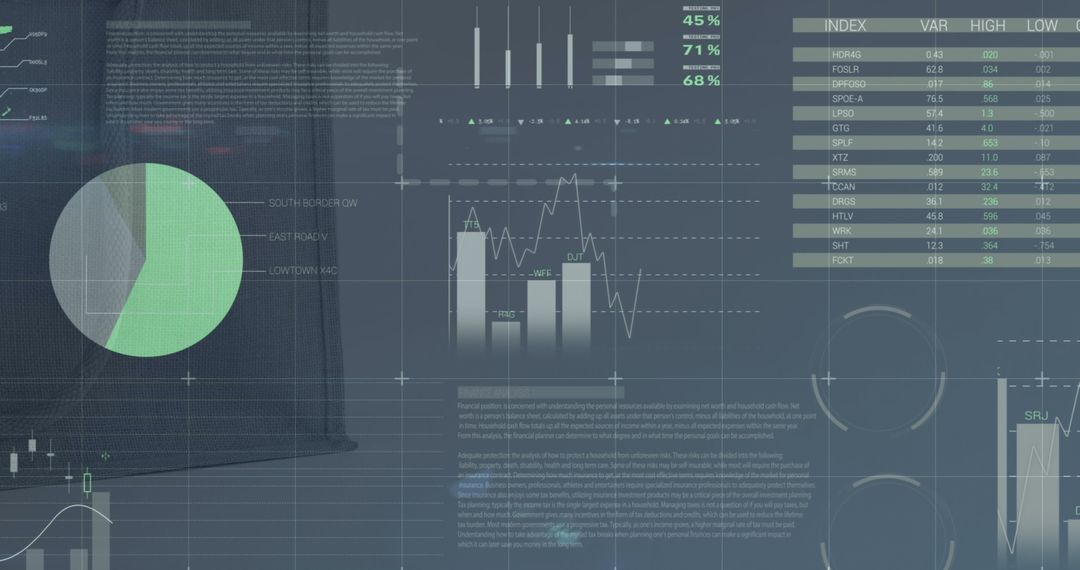
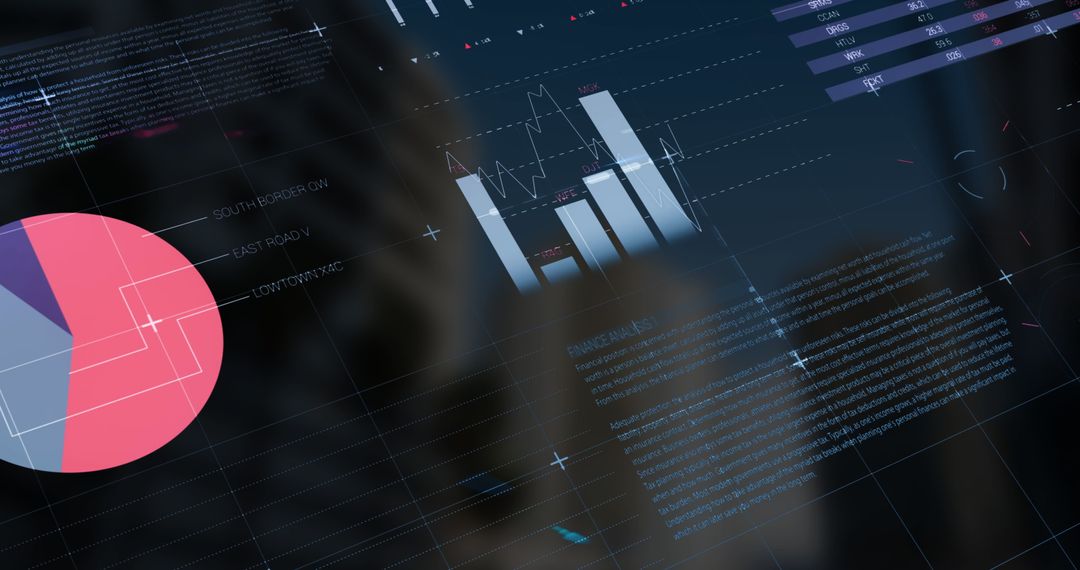
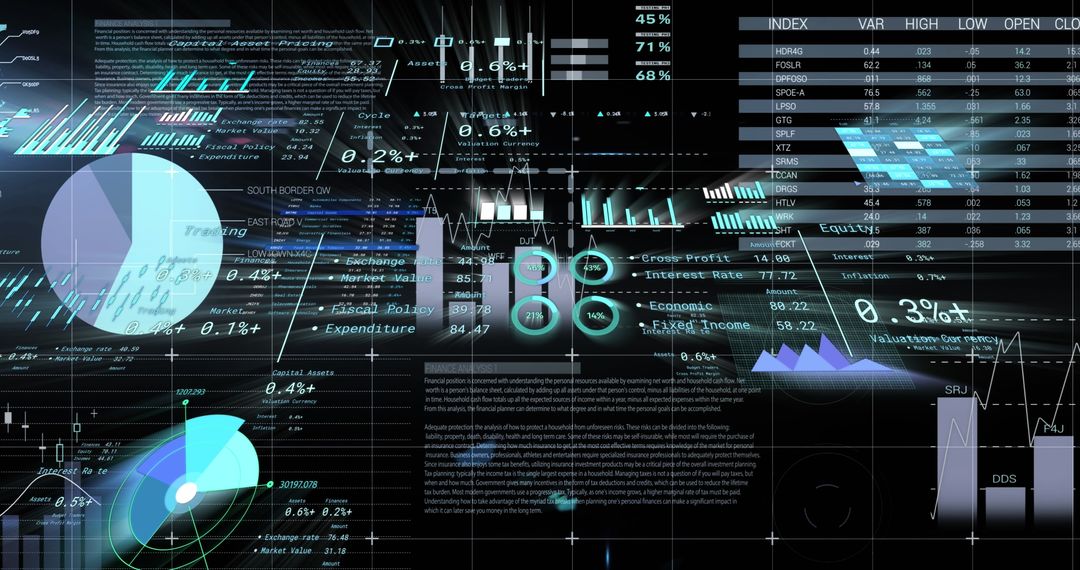
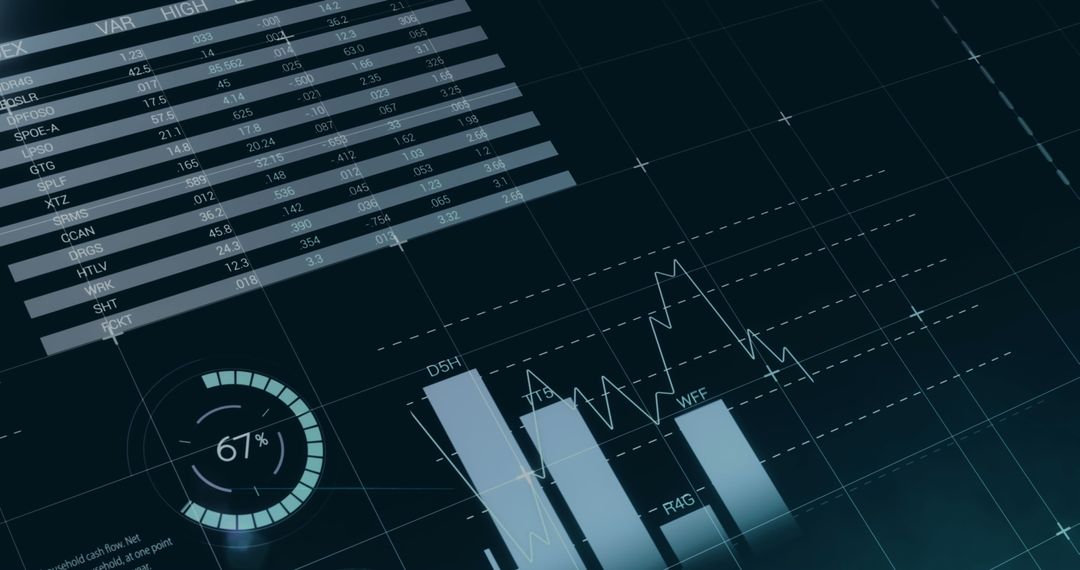
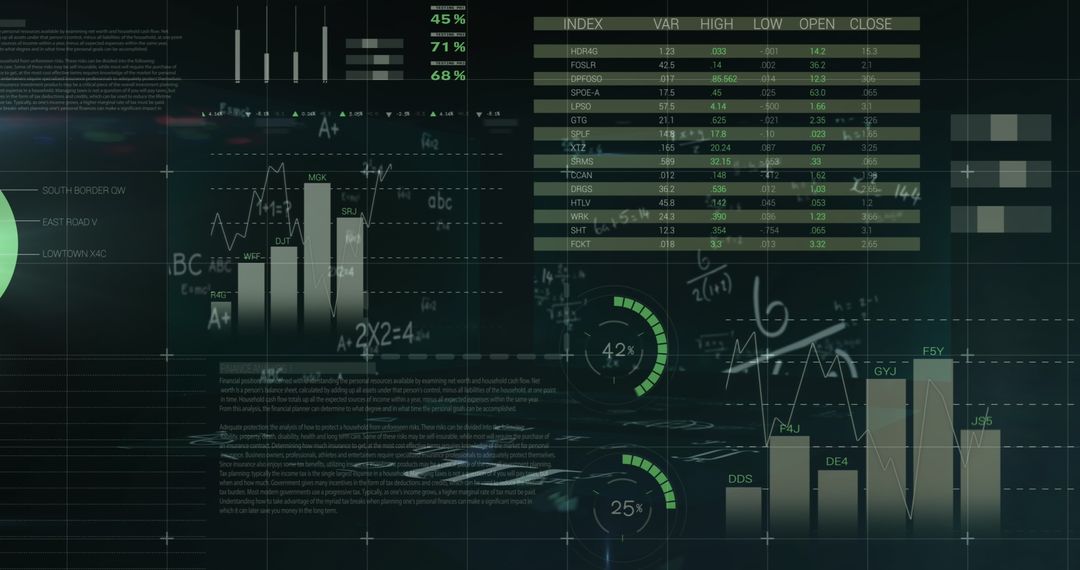
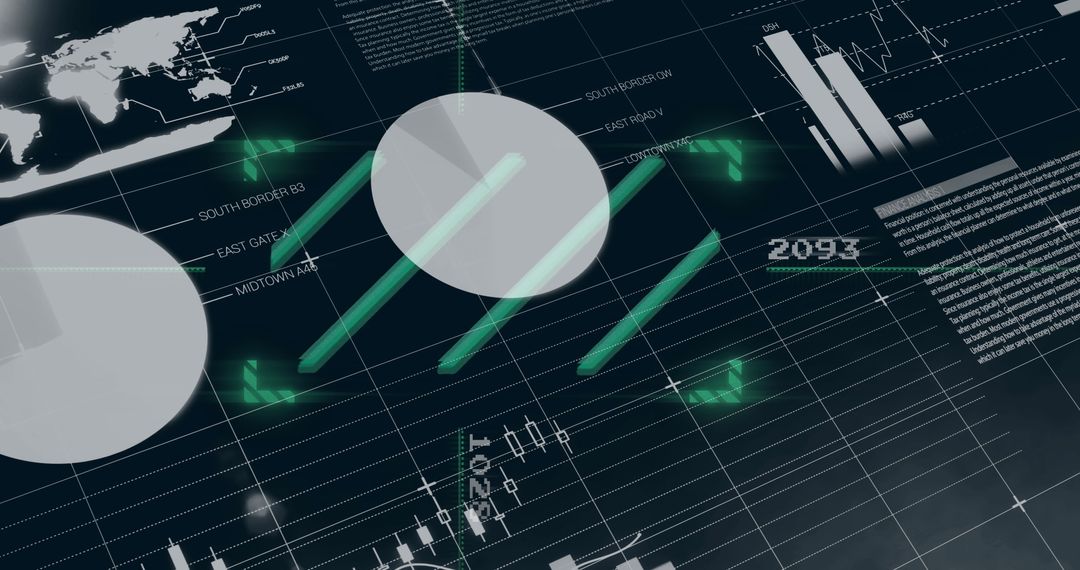
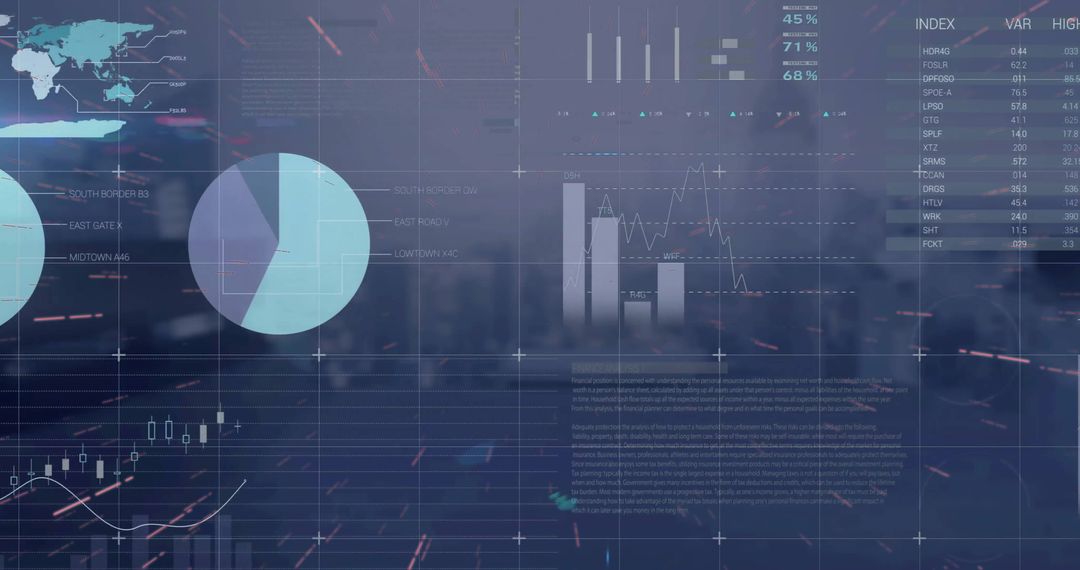
- Futuristic Holographic Analytics Dashboard Display
Futuristic Holographic Analytics Dashboard Display Image

Visualizes a modern, high-tech analytics dashboard incorporating holographic technology and data graphs. Ideal for illustrating concepts in digital innovation, data-driven decision-making, or advancements in technology interfaces. Suitable for use in tech presentations, reports on data science, futuristic project discussions, and enhancing visuals in digital development showcasing.
Powered by  - Get 15% off with code: PIKWIZARD15


2
downloads
downloads
Tags:
More
Credit Photo
If you would like to credit the Photo, here are some ways you can do so
Text Link
photo Link
<span class="text-link">
<span>
<a target="_blank" href=https://pikwizard.com/photo/futuristic-holographic-analytics-dashboard-display/55795a4198fc967bab5918eab672f199/>PikWizard</a>
</span>
</span>
<span class="image-link">
<span
style="margin: 0 0 20px 0; display: inline-block; vertical-align: middle; width: 100%;"
>
<a
target="_blank"
href="https://pikwizard.com/photo/futuristic-holographic-analytics-dashboard-display/55795a4198fc967bab5918eab672f199/"
style="text-decoration: none; font-size: 10px; margin: 0;"
>
<img src="https://pikwizard.com/pw/medium/55795a4198fc967bab5918eab672f199.jpg" style="margin: 0; width: 100%;" alt="" />
<p style="font-size: 12px; margin: 0;">PikWizard</p>
</a>
</span>
</span>
Free (free of charge)
Free for personal and commercial use.
Author: People Creations