
- Home >
- Stock Photos >
- Futuristic Holographic Candlestick Chart and Data Visualizations
Futuristic Holographic Candlestick Chart and Data Visualizations Image
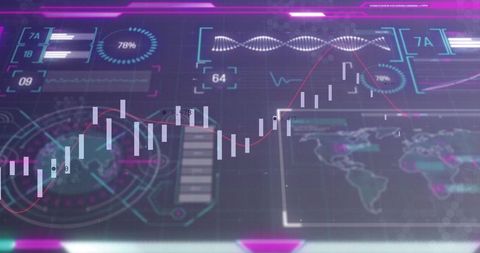
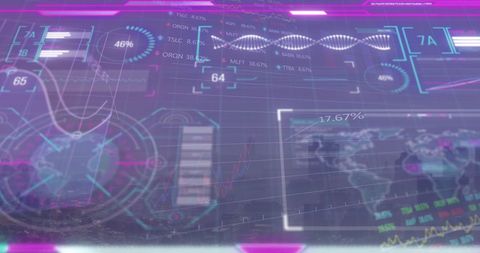
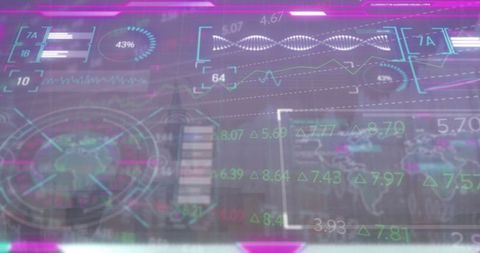
Futuristic holographic candlestick chart displaying various data visualizations and analytics tools. Includes abstract elements like digital interfaces and neon highlights. Red trend line indicates market analysis. Useful for illustrating advanced technology features, financial forecasting methods, stock market analysis tools, and data strategies.
Powered by 


downloads
Tags:
More
Credit Photo
If you would like to credit the Photo, here are some ways you can do so
Text Link
photo Link
<span class="text-link">
<span>
<a target="_blank" href=https://pikwizard.com/photo/futuristic-holographic-candlestick-chart-and-data-visualizations/8ce63f3a2ac27b210c0d852fae73fc60/>PikWizard</a>
</span>
</span>
<span class="image-link">
<span
style="margin: 0 0 20px 0; display: inline-block; vertical-align: middle; width: 100%;"
>
<a
target="_blank"
href="https://pikwizard.com/photo/futuristic-holographic-candlestick-chart-and-data-visualizations/8ce63f3a2ac27b210c0d852fae73fc60/"
style="text-decoration: none; font-size: 10px; margin: 0;"
>
<img src="https://pikwizard.com/pw/medium/8ce63f3a2ac27b210c0d852fae73fc60.jpg" style="margin: 0; width: 100%;" alt="" />
<p style="font-size: 12px; margin: 0;">PikWizard</p>
</a>
</span>
</span>
Free (free of charge)
Free for personal and commercial use.
Author: Authentic Images
Similar Free Stock Images

Premium


Premium

Premium


Premium


Premium


Premium


Premium


Premium


Premium


Premium


Premium


Premium


Premium


Premium

Premium

Premium


Premium


Premium


Premium


Premium


Premium


Premium


Premium


Premium


Premium

Explore More Free Stock Images