- Home >
- Stock Photos >
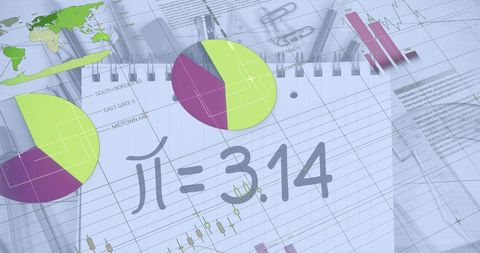
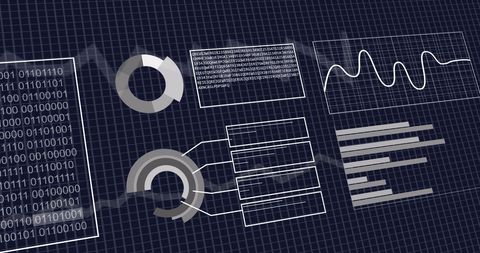
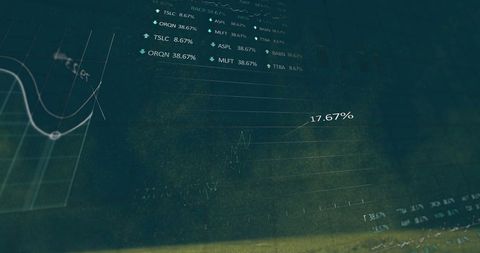
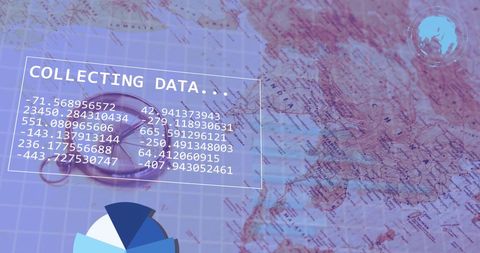
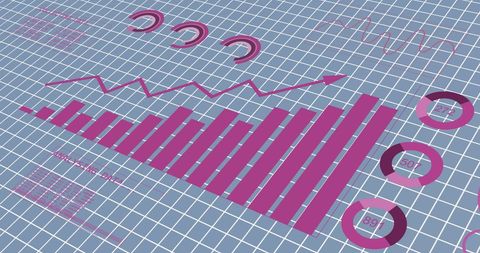
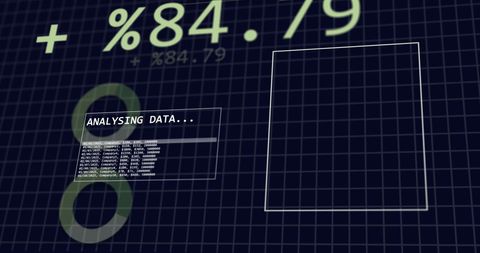
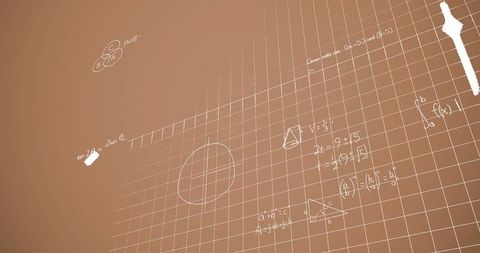
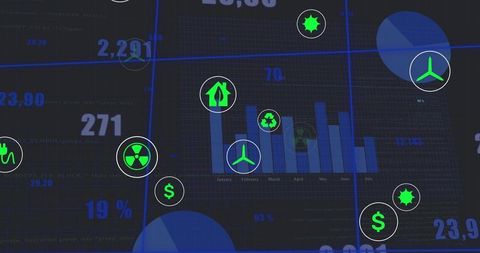
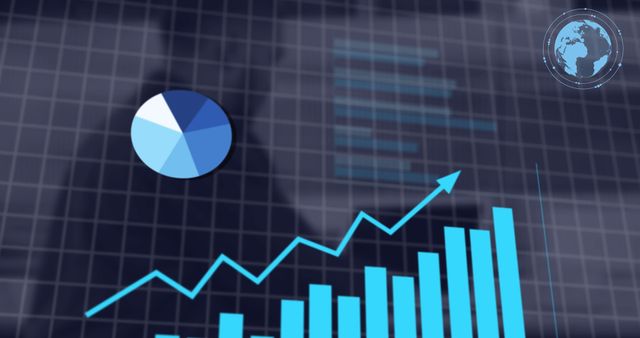
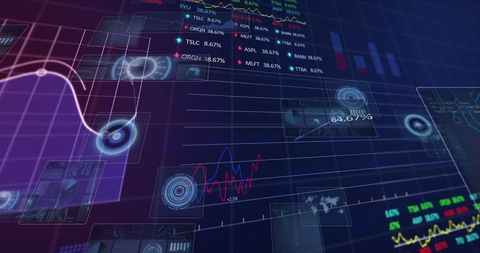
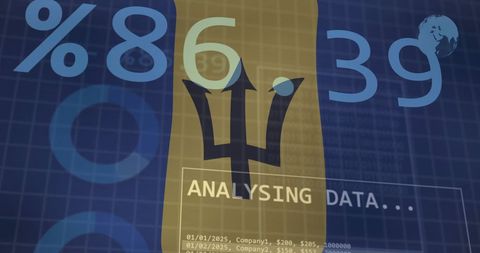
- Futuristic Holographic Financial Data Analysis on Dark Interface
Futuristic Holographic Financial Data Analysis on Dark Interface Image

This modern depiction highlights dynamic financial data, represented through futuristic holographic elements including charts and a global symbol. Ideal for illustrating business reports, technological advancements, globalization impact, or corporate growth strategies. Also useful for subjects related to digital transformation.
Powered by  - Get 15% off with code: PIKWIZARD15


2
downloads
downloads
Tags:
More
Credit Photo
If you would like to credit the Photo, here are some ways you can do so
Text Link
photo Link
<span class="text-link">
<span>
<a target="_blank" href=https://pikwizard.com/photo/futuristic-holographic-financial-data-analysis-on-dark-interface/ab9b89305f697be1768faac3f7b2c713/>PikWizard</a>
</span>
</span>
<span class="image-link">
<span
style="margin: 0 0 20px 0; display: inline-block; vertical-align: middle; width: 100%;"
>
<a
target="_blank"
href="https://pikwizard.com/photo/futuristic-holographic-financial-data-analysis-on-dark-interface/ab9b89305f697be1768faac3f7b2c713/"
style="text-decoration: none; font-size: 10px; margin: 0;"
>
<img src="https://pikwizard.com/pw/medium/ab9b89305f697be1768faac3f7b2c713.jpg" style="margin: 0; width: 100%;" alt="" />
<p style="font-size: 12px; margin: 0;">PikWizard</p>
</a>
</span>
</span>
Free (free of charge)
Free for personal and commercial use.
Author: Creative Art
Similar Free Stock Images
Loading...

Premium


Premium

Premium


Premium


Premium


Premium

Premium


Premium


Premium


Premium


Premium


Premium


Premium


Premium


Premium

Premium


Premium


Premium

Premium


Premium


Premium


Premium


Premium


Premium


Premium