- Home >
- Stock Photos >
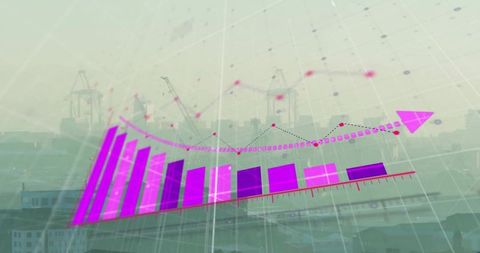
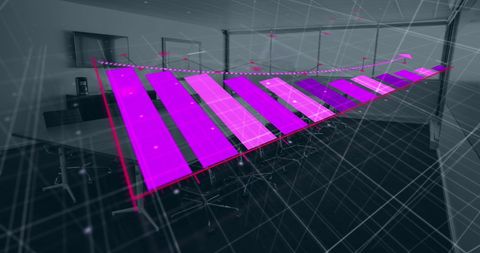
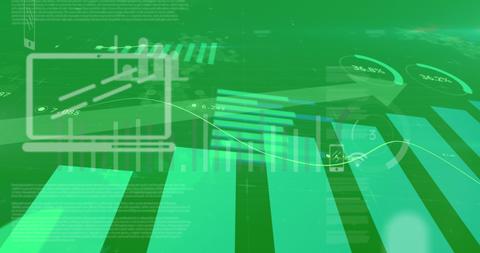
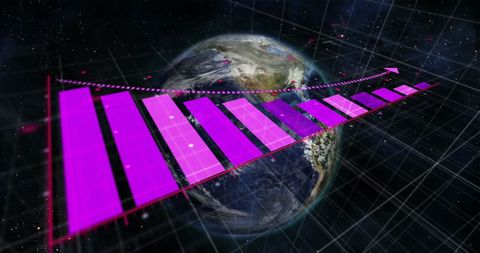
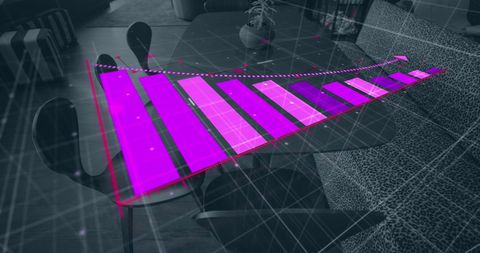
- Futuristic Infographic Display with Glowing Pink Bar Graph
Futuristic Infographic Display with Glowing Pink Bar Graph Image

Visual representation showing a bright pink bar graph extending diagonally across a virtual digital interface. The graphical elements suggest themes of data analytics, business intelligence, and futuristic technology. Ideal for illustrating concepts in technology business presentations, global communication strategies, or digital data security materials.
Powered by 


2
downloads
downloads
Tags:
More
Credit Photo
If you would like to credit the Photo, here are some ways you can do so
Text Link
photo Link
<span class="text-link">
<span>
<a target="_blank" href=https://pikwizard.com/photo/futuristic-infographic-display-with-glowing-pink-bar-graph/25e3f6d40f62122194552398bdbbda20/>PikWizard</a>
</span>
</span>
<span class="image-link">
<span
style="margin: 0 0 20px 0; display: inline-block; vertical-align: middle; width: 100%;"
>
<a
target="_blank"
href="https://pikwizard.com/photo/futuristic-infographic-display-with-glowing-pink-bar-graph/25e3f6d40f62122194552398bdbbda20/"
style="text-decoration: none; font-size: 10px; margin: 0;"
>
<img src="https://pikwizard.com/pw/medium/25e3f6d40f62122194552398bdbbda20.jpg" style="margin: 0; width: 100%;" alt="" />
<p style="font-size: 12px; margin: 0;">PikWizard</p>
</a>
</span>
</span>
Free (free of charge)
Free for personal and commercial use.
Author: Awesome Content
Similar Free Stock Images

Premium


Premium


Premium


Premium


Premium


Premium


Premium


Premium


Premium


Premium


Premium


Premium


Premium


Premium


Premium


Premium


Premium


Premium


Premium


Premium


Premium


Premium


Premium


Premium


Premium