- Home >
- Stock Photos >
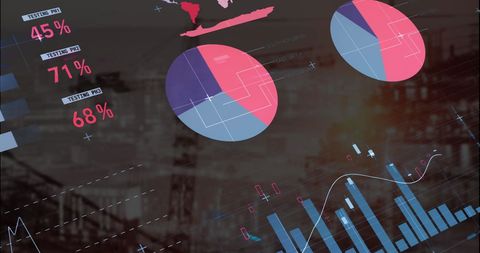
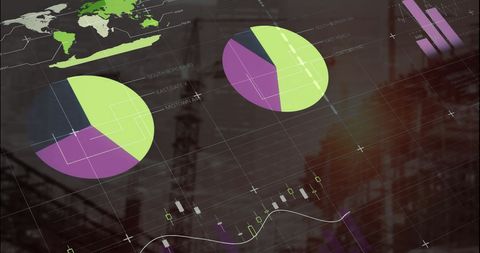
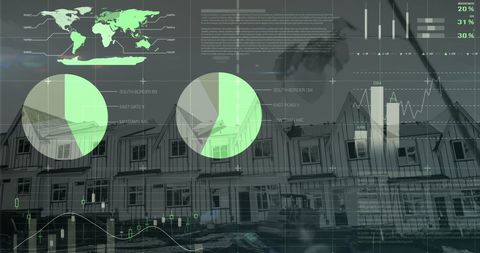
- Futuristic Interface with Data Visualizations and Analytics
Futuristic Interface with Data Visualizations and Analytics Image

Image depicts advanced data visualizations on a sleek interface, ideal for presentations about technology, business analytics, and global strategy. Useful in illustrating concepts of data analysis and sharing information in educational or corporate contexts.

downloads
Tags:
More
Credit Photo
If you would like to credit the Photo, here are some ways you can do so
Text Link
photo Link
<span class="text-link">
<span>
<a target="_blank" href=https://pikwizard.com/photo/futuristic-interface-with-data-visualizations-and-analytics/f4aa5d09618de11cb13221174500610a/>PikWizard</a>
</span>
</span>
<span class="image-link">
<span
style="margin: 0 0 20px 0; display: inline-block; vertical-align: middle; width: 100%;"
>
<a
target="_blank"
href="https://pikwizard.com/photo/futuristic-interface-with-data-visualizations-and-analytics/f4aa5d09618de11cb13221174500610a/"
style="text-decoration: none; font-size: 10px; margin: 0;"
>
<img src="https://pikwizard.com/pw/medium/f4aa5d09618de11cb13221174500610a.jpg" style="margin: 0; width: 100%;" alt="" />
<p style="font-size: 12px; margin: 0;">PikWizard</p>
</a>
</span>
</span>
Free (free of charge)
Free for personal and commercial use.
Author: Authentic Images