- Home >
- Stock Photos >
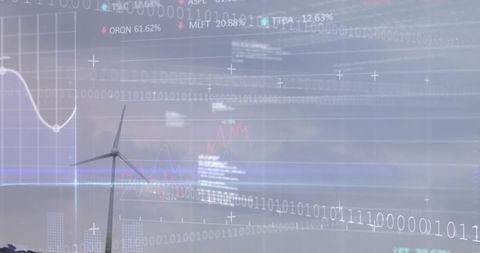
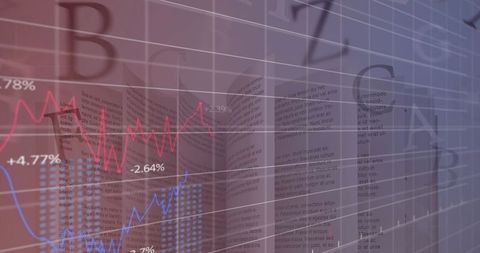
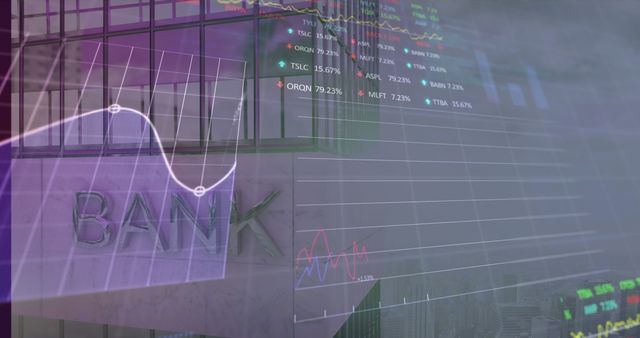
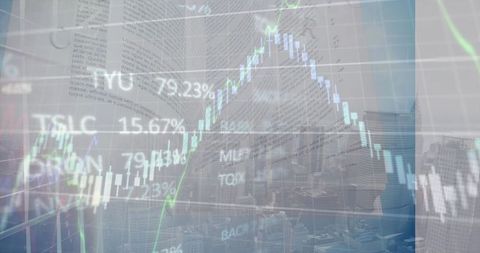
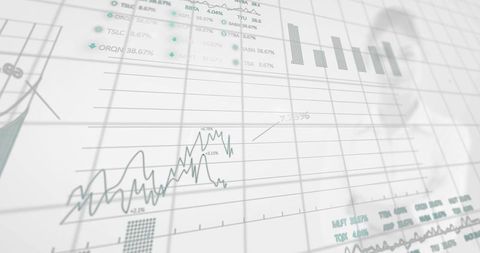
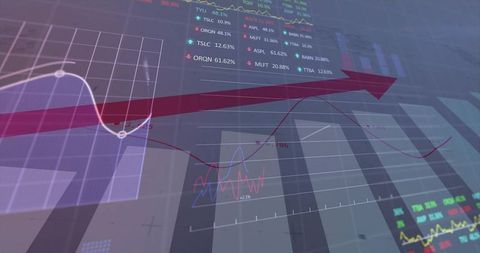
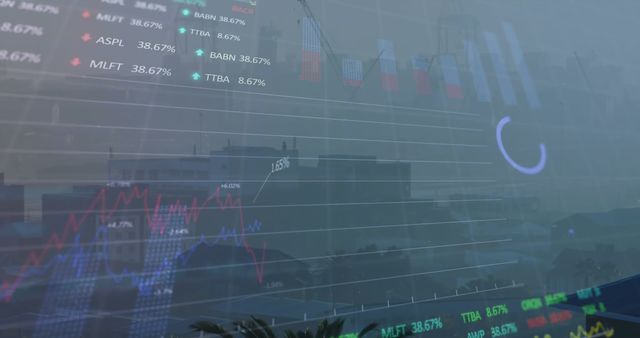
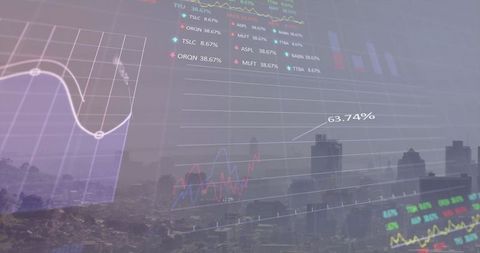
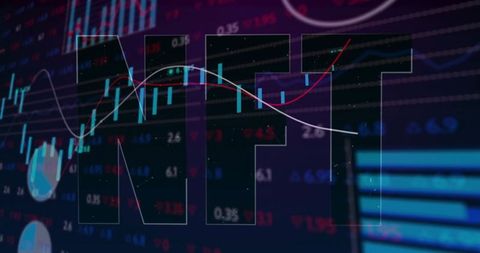
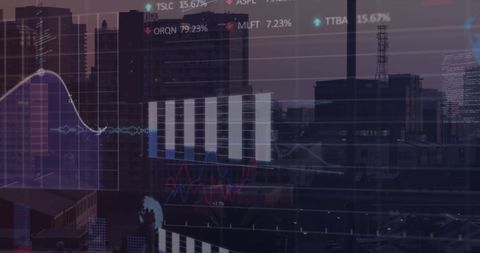
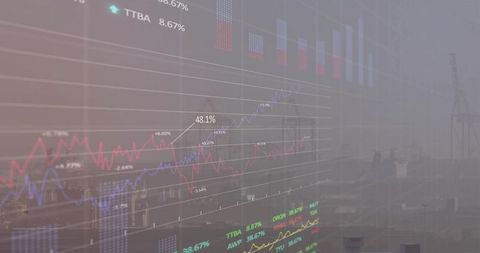
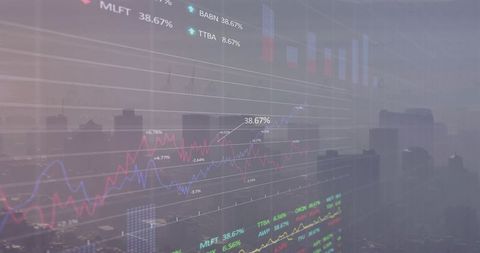
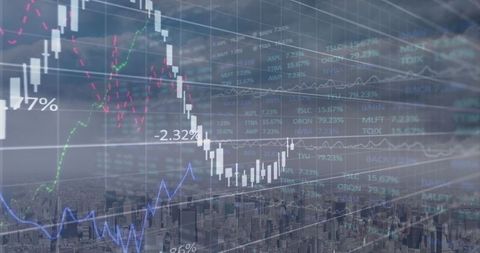
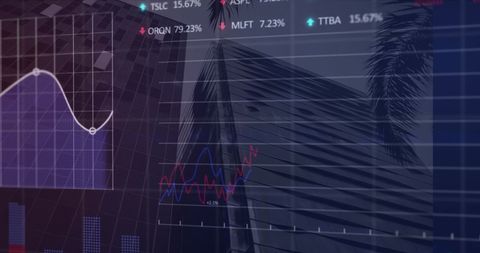
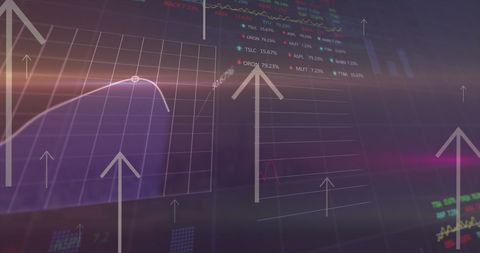
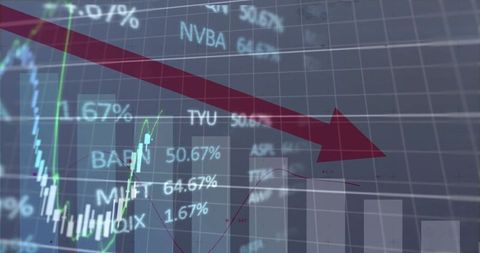
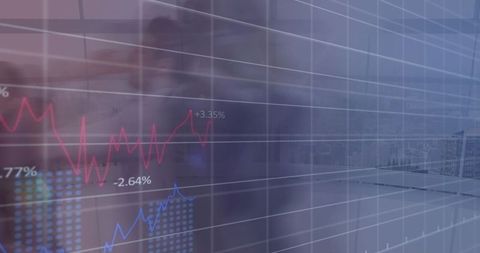
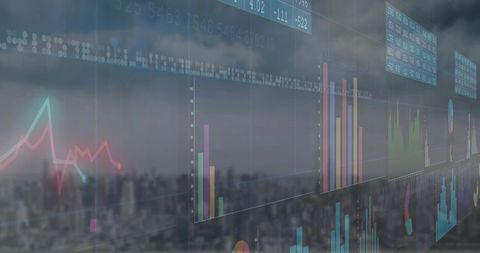
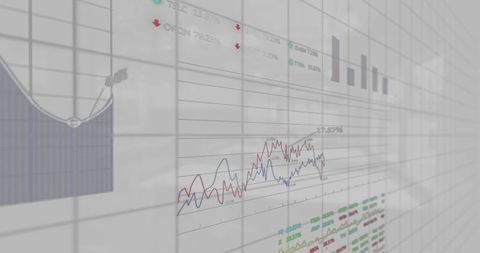
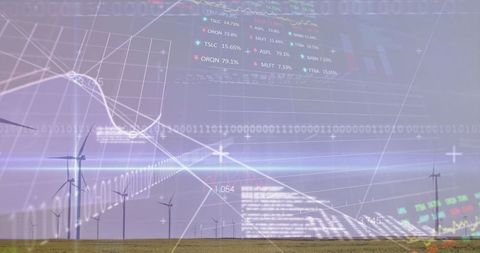
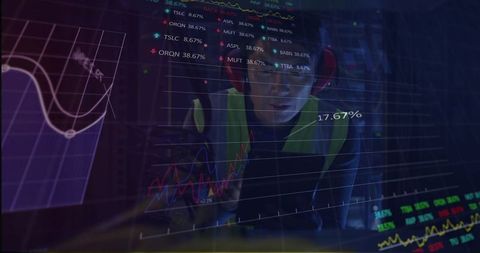
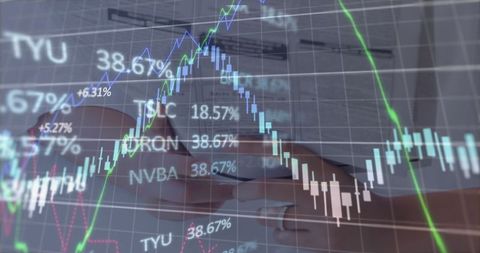
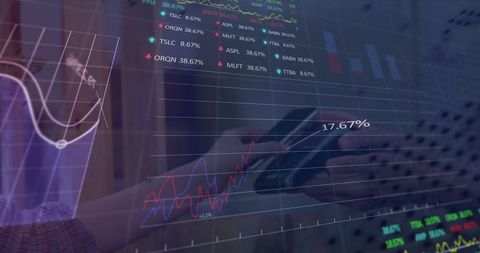
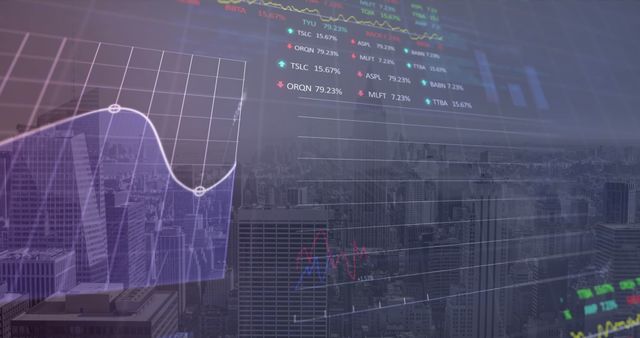
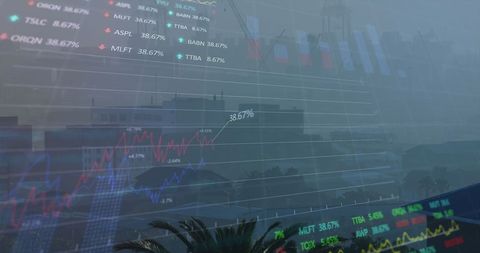
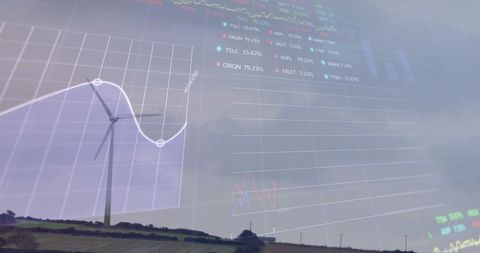
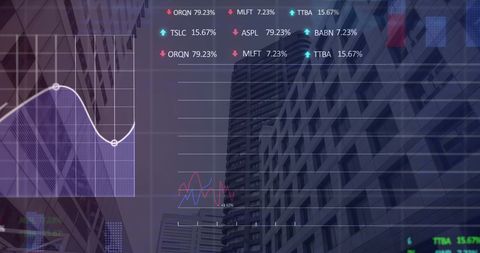
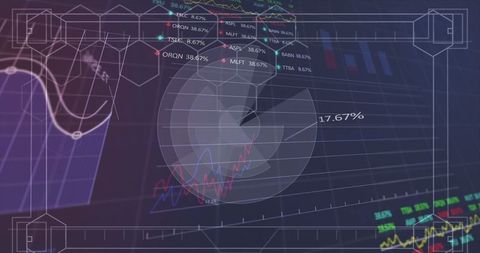
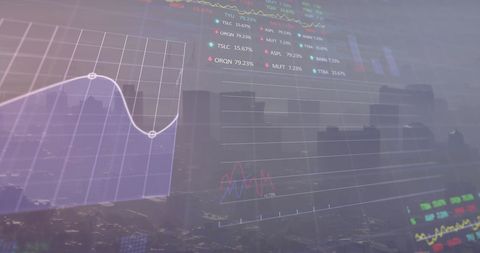
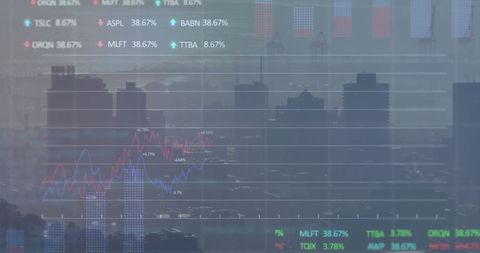
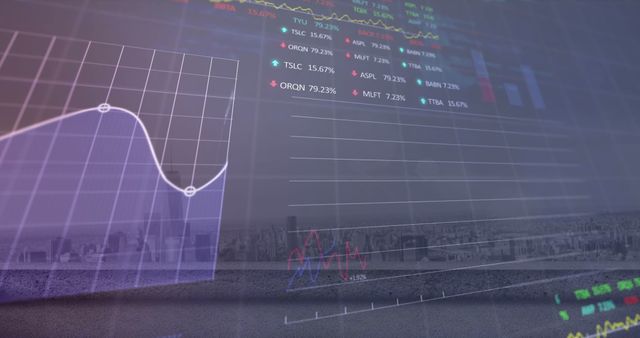
- Futuristic Interface with Graphs Displayed on Transparent Screen
Futuristic Interface with Graphs Displayed on Transparent Screen Image

This visual represents a high-tech trading environment featuring a digital interface for data visualization. The transparent screen displays red and blue graphs, indicating financial progress, innovations in data management, or investment environments. It can enhance representations of modern business operations, analytical methods, or technological advancements in presentations and marketing materials.

downloads
Tags:
More
Credit Photo
If you would like to credit the Photo, here are some ways you can do so
Text Link
photo Link
<span class="text-link">
<span>
<a target="_blank" href=https://pikwizard.com/photo/futuristic-interface-with-graphs-displayed-on-transparent-screen/592d20d56844f085587a8cae341dc1d6/>PikWizard</a>
</span>
</span>
<span class="image-link">
<span
style="margin: 0 0 20px 0; display: inline-block; vertical-align: middle; width: 100%;"
>
<a
target="_blank"
href="https://pikwizard.com/photo/futuristic-interface-with-graphs-displayed-on-transparent-screen/592d20d56844f085587a8cae341dc1d6/"
style="text-decoration: none; font-size: 10px; margin: 0;"
>
<img src="https://pikwizard.com/pw/medium/592d20d56844f085587a8cae341dc1d6.jpg" style="margin: 0; width: 100%;" alt="" />
<p style="font-size: 12px; margin: 0;">PikWizard</p>
</a>
</span>
</span>
Free (free of charge)
Free for personal and commercial use.
Author: Authentic Images