
- Home >
- Stock Photos >
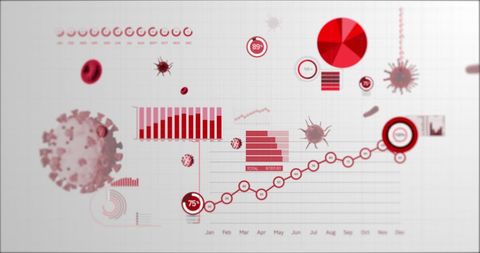
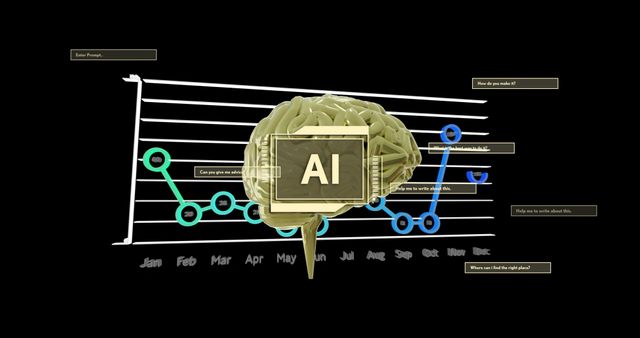
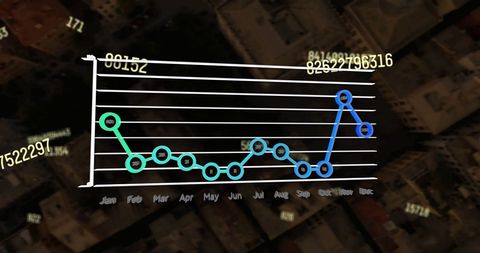
- Futuristic Line Chart Analytics on Digital Interface
Futuristic Line Chart Analytics on Digital Interface Image

Depicts line chart with prominent data points and techno-digital theme. Ideal for illustrating progress and growth in business reports, data analysis presentations, and technology articles focusing on innovation and performance metrics. Perfect for digital and corporate use.
Powered by 


downloads
Tags:
More
Credit Photo
If you would like to credit the Photo, here are some ways you can do so
Text Link
photo Link
<span class="text-link">
<span>
<a target="_blank" href=https://pikwizard.com/photo/futuristic-line-chart-analytics-on-digital-interface/ba3511019d87bd6d2dd6614a33211d76/>PikWizard</a>
</span>
</span>
<span class="image-link">
<span
style="margin: 0 0 20px 0; display: inline-block; vertical-align: middle; width: 100%;"
>
<a
target="_blank"
href="https://pikwizard.com/photo/futuristic-line-chart-analytics-on-digital-interface/ba3511019d87bd6d2dd6614a33211d76/"
style="text-decoration: none; font-size: 10px; margin: 0;"
>
<img src="https://pikwizard.com/pw/medium/ba3511019d87bd6d2dd6614a33211d76.jpg" style="margin: 0; width: 100%;" alt="" />
<p style="font-size: 12px; margin: 0;">PikWizard</p>
</a>
</span>
</span>
Free (free of charge)
Free for personal and commercial use.
Author: People Creations
Similar Free Stock Images

Premium


Premium

Premium

Premium


Premium


Premium

Premium

Premium


Premium


Premium

Premium


Premium

Premium

Premium


Premium


Premium


Premium


Premium


Premium

Premium


Premium

Premium


Premium


Premium


Premium

Explore More Free Stock Images