
- Home >
- Stock Photos >
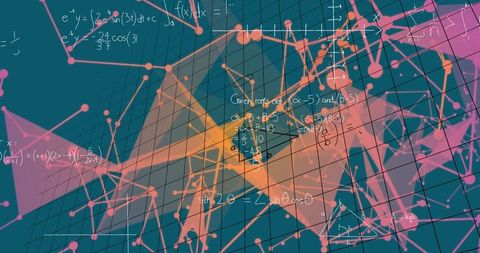
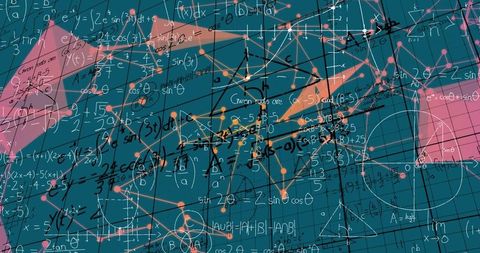
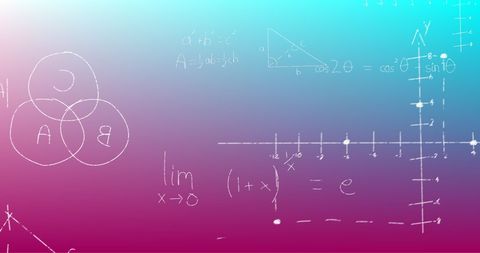
- Futuristic Mathematical Connection Network with Formulas
Futuristic Mathematical Connection Network with Formulas Image
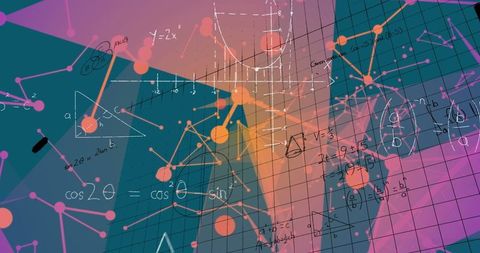
Illustration showcasing interconnected nodes, mathematical formulas on abstract colorful background embodied by grid overlay, reflecting innovation in science and technology. Suitable for use in educational material, science magazines, technology blog posts, and digital art projects demonstrating mathematical interconnectivity and futuristic data networks.
Powered by 


downloads
Tags:
More
Credit Photo
If you would like to credit the Photo, here are some ways you can do so
Text Link
photo Link
<span class="text-link">
<span>
<a target="_blank" href=https://pikwizard.com/photo/futuristic-mathematical-connection-network-with-formulas/c8b17e3d8c0ea59f4c8b5f548a9e0a0e/>PikWizard</a>
</span>
</span>
<span class="image-link">
<span
style="margin: 0 0 20px 0; display: inline-block; vertical-align: middle; width: 100%;"
>
<a
target="_blank"
href="https://pikwizard.com/photo/futuristic-mathematical-connection-network-with-formulas/c8b17e3d8c0ea59f4c8b5f548a9e0a0e/"
style="text-decoration: none; font-size: 10px; margin: 0;"
>
<img src="https://pikwizard.com/pw/medium/c8b17e3d8c0ea59f4c8b5f548a9e0a0e.jpg" style="margin: 0; width: 100%;" alt="" />
<p style="font-size: 12px; margin: 0;">PikWizard</p>
</a>
</span>
</span>
Free (free of charge)
Free for personal and commercial use.
Author: Creative Art
Similar Free Stock Images

Premium


Premium

Premium
Premium


Premium


Premium


Premium

Premium


Premium


Premium

Premium

Premium


AI


Premium


Premium

Premium

Premium


Premium


Premium

Premium


Premium


AI


Premium

Premium


Premium

Premium


Premium

Explore More Free Stock Images