- Home >
- Stock Photos >
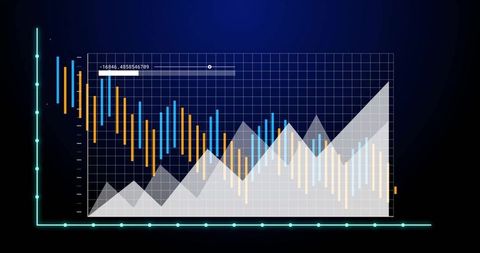
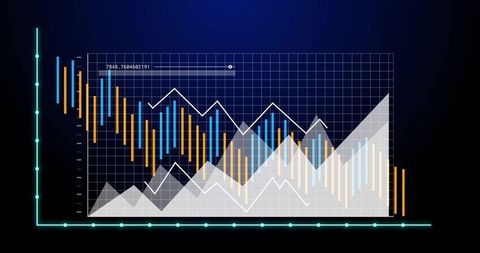
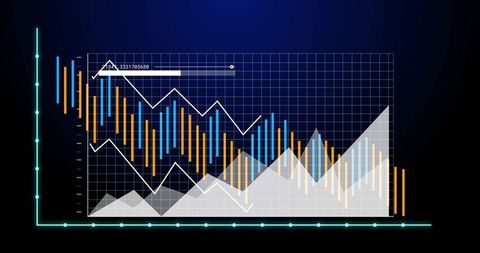
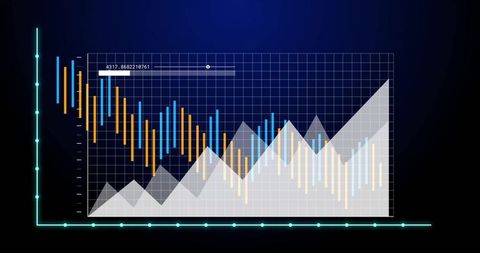
- Futuristic Multi-Series Data Visualization Dashboard Chart
Futuristic Multi-Series Data Visualization Dashboard Chart Image
This illustration portrays a digital multi-series data visualization chart, suitable for technology and finance fields. It features a vibrant grid overlay in a sleek dark GUI setting, with colorful bar representations denoting various data points. Ideal for use in presentations, technology blogs, and analytics reports, emphasizing digital innovation and financial analytics.

downloads
Tags:
More
Credit Photo
If you would like to credit the Photo, here are some ways you can do so
Text Link
photo Link
<span class="text-link">
<span>
<a target="_blank" href=https://pikwizard.com/photo/futuristic-multi-series-data-visualization-dashboard-chart/d038c010b6302ca933a325f9fdeada3d/>PikWizard</a>
</span>
</span>
<span class="image-link">
<span
style="margin: 0 0 20px 0; display: inline-block; vertical-align: middle; width: 100%;"
>
<a
target="_blank"
href="https://pikwizard.com/photo/futuristic-multi-series-data-visualization-dashboard-chart/d038c010b6302ca933a325f9fdeada3d/"
style="text-decoration: none; font-size: 10px; margin: 0;"
>
<img src="https://pikwizard.com/pw/medium/d038c010b6302ca933a325f9fdeada3d.jpg" style="margin: 0; width: 100%;" alt="" />
<p style="font-size: 12px; margin: 0;">PikWizard</p>
</a>
</span>
</span>
Free (free of charge)
Free for personal and commercial use.
Author: People Creations