- Home >
- Stock Photos >
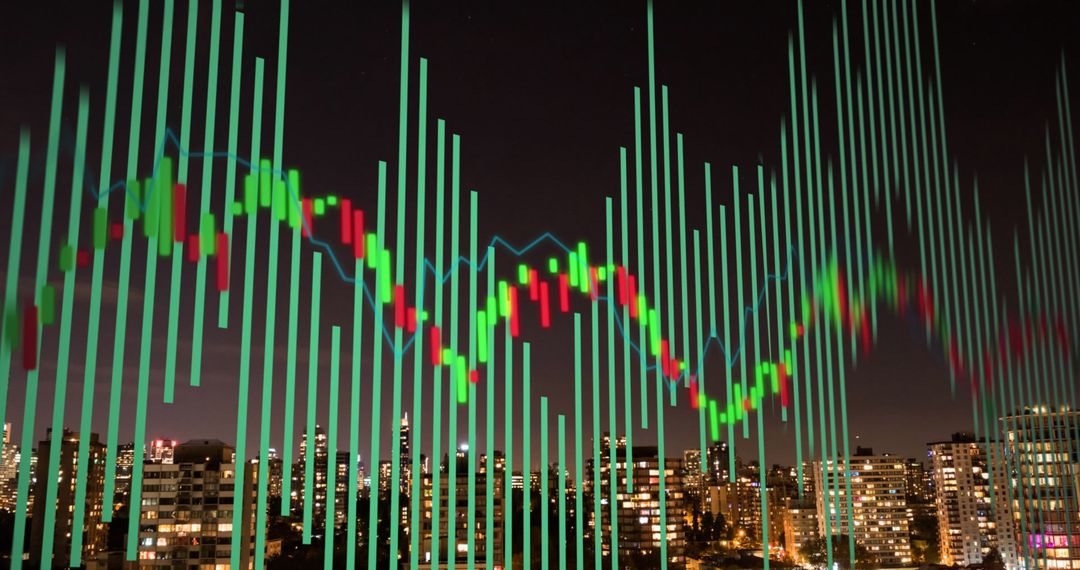
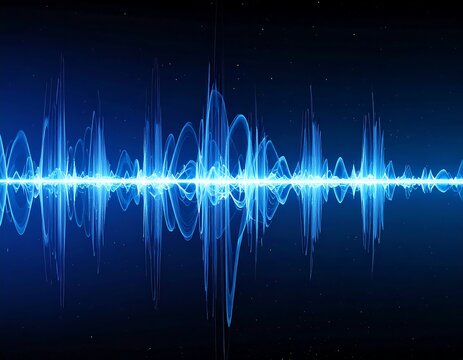
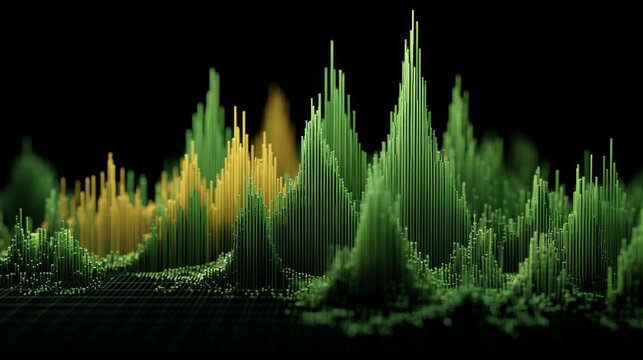
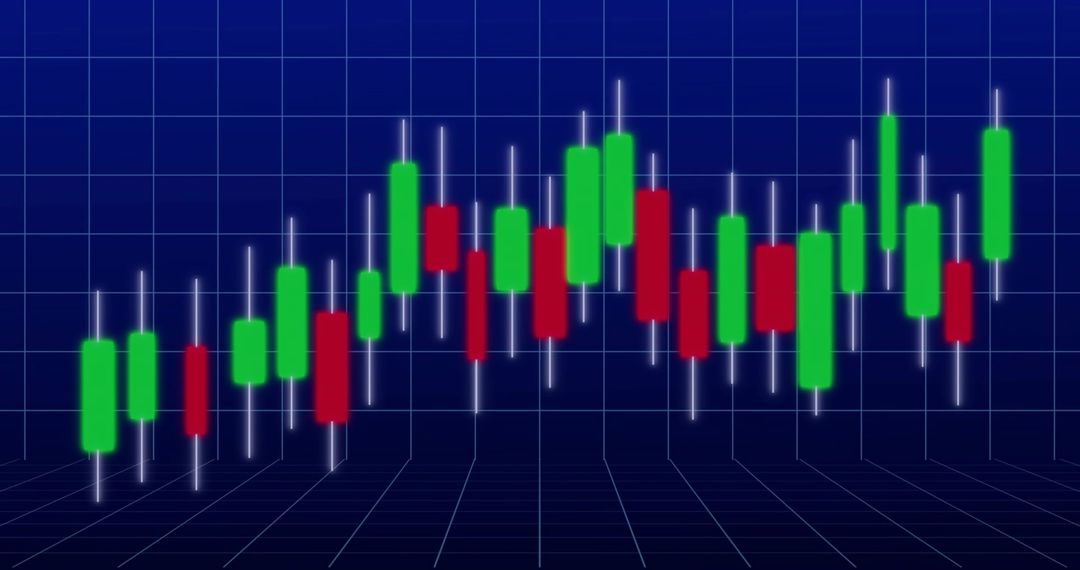
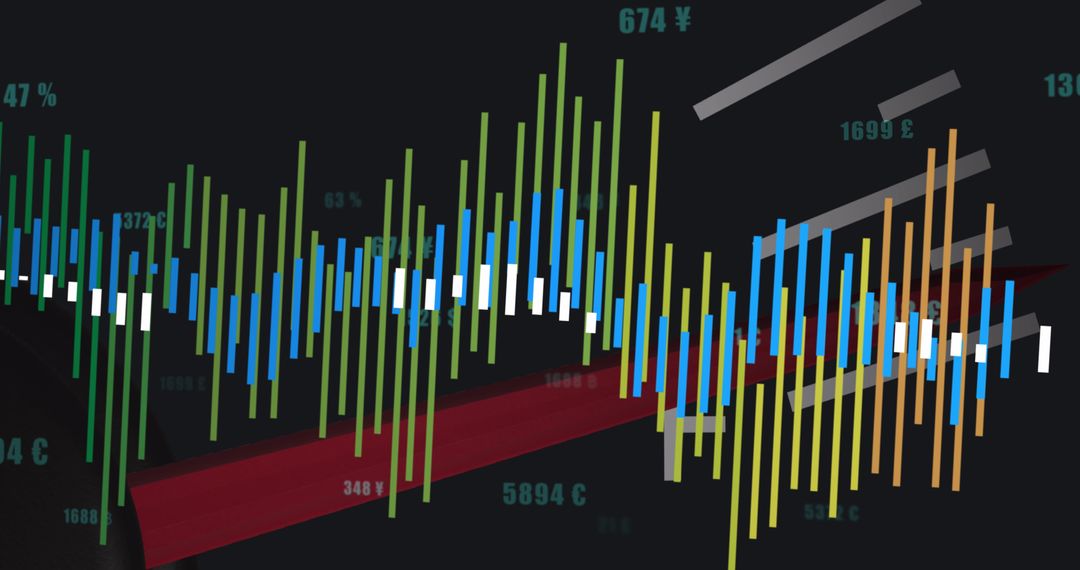
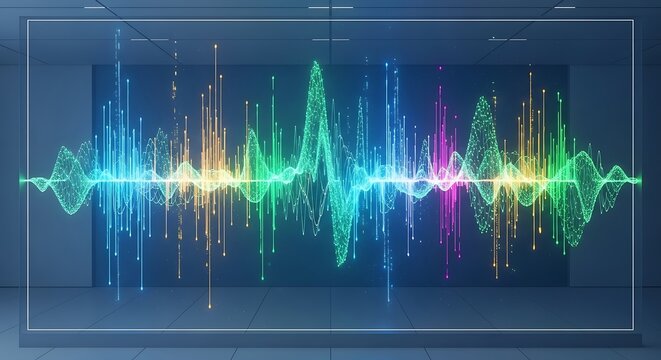
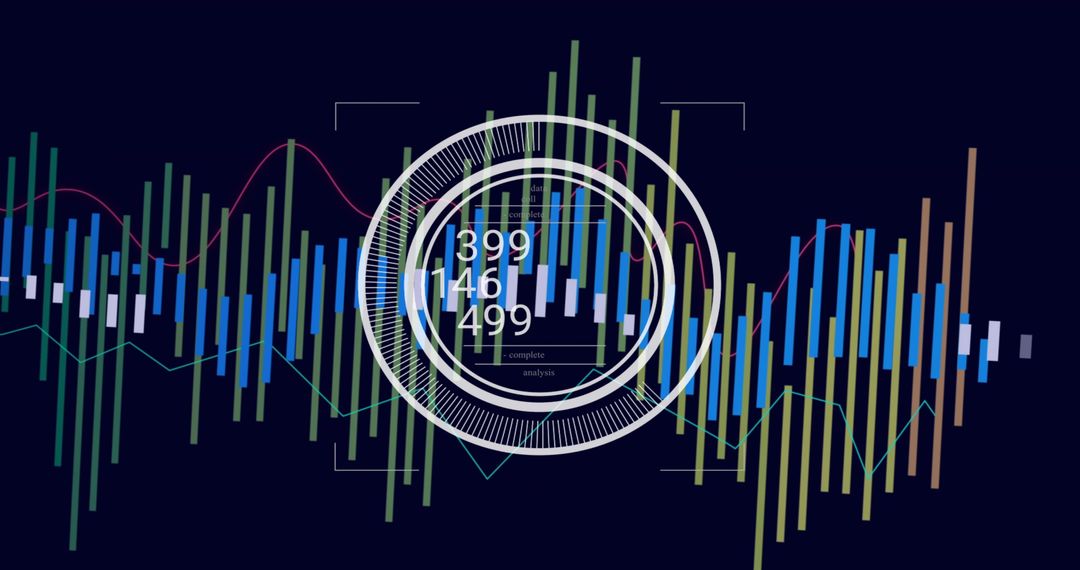
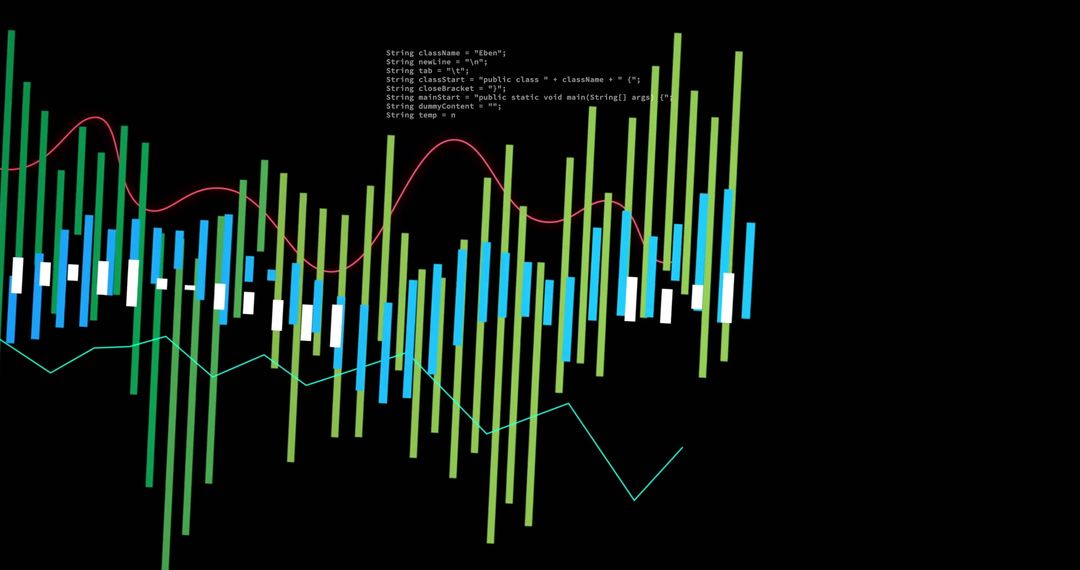
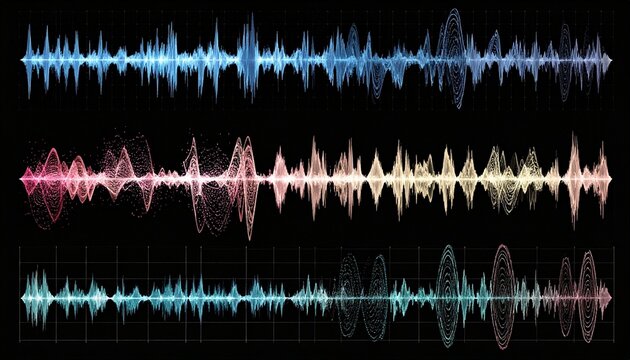
- Futuristic multicolor vertical waveform bars with faint scientific equations and molecules
Futuristic multicolor vertical waveform bars with faint scientific equations and molecules Image

Futuristic composition showing multicolor vertical bars forming waveform across black canvas, featuring faint chemical formulas and mathematical equations layered behind. High contrast palette combining neon green, electric blue, mustard yellow and burnt orange, creating strong visual rhythm and depth. Center white bar sequence providing natural space for logo or headline overlay. Suiting technology, science, audio and data analytics themes, working well for website hero banners, presentation slides, report covers, blog headers, social media posts, podcast or album art, UI backgrounds and marketing materials. Offering modern, data-driven aesthetic for editorial designs, technical articles, product launches and corporate branding.
Powered by 


0
downloads
downloads
Tags:
More
Credit Photo
If you would like to credit the Photo, here are some ways you can do so
Text Link
photo Link
<span class="text-link">
<span>
<a target="_blank" href=https://pikwizard.com/photo/futuristic-multicolor-vertical-waveform-bars-with-faint-scientific-equations-and-molecules/01726ba4a09c564dc8a1254c88182a2e/>PikWizard</a>
</span>
</span>
<span class="image-link">
<span
style="margin: 0 0 20px 0; display: inline-block; vertical-align: middle; width: 100%;"
>
<a
target="_blank"
href="https://pikwizard.com/photo/futuristic-multicolor-vertical-waveform-bars-with-faint-scientific-equations-and-molecules/01726ba4a09c564dc8a1254c88182a2e/"
style="text-decoration: none; font-size: 10px; margin: 0;"
>
<img src="https://pikwizard.com/pw/medium/01726ba4a09c564dc8a1254c88182a2e.jpg" style="margin: 0; width: 100%;" alt="" />
<p style="font-size: 12px; margin: 0;">PikWizard</p>
</a>
</span>
</span>
Free (free of charge)
Free for personal and commercial use.
Author: Authentic Images
Similar Free Stock Images

Premium


Premium


Premium


Premium


Premium

Premium


Premium


Premium


Premium


Premium


Premium


Premium


Premium


Premium


Premium


Premium


Premium
Premium


Premium


Premium


Premium


Premium


Premium


Premium