- Home >
- Stock Photos >
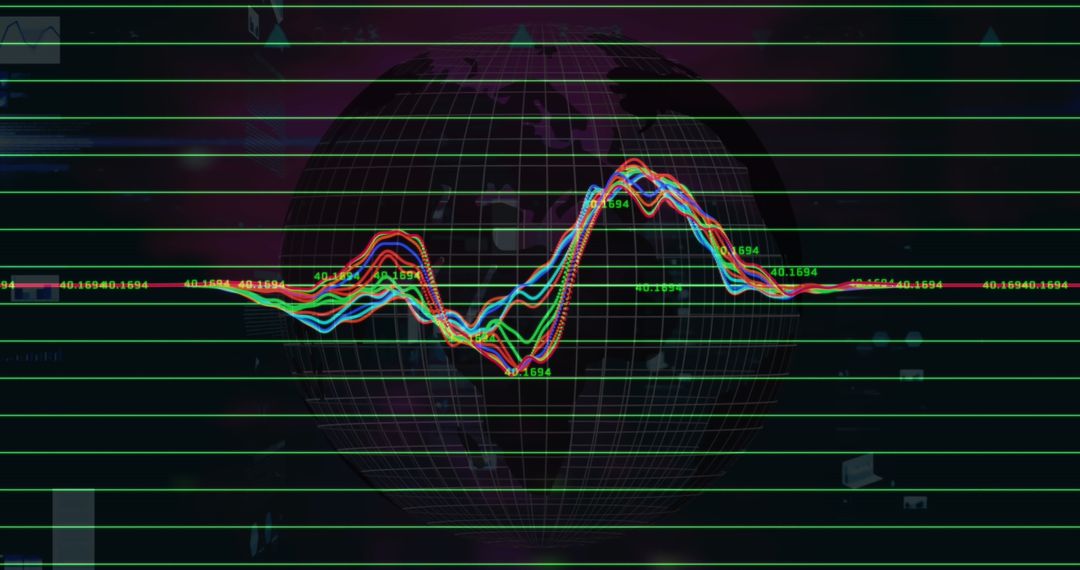
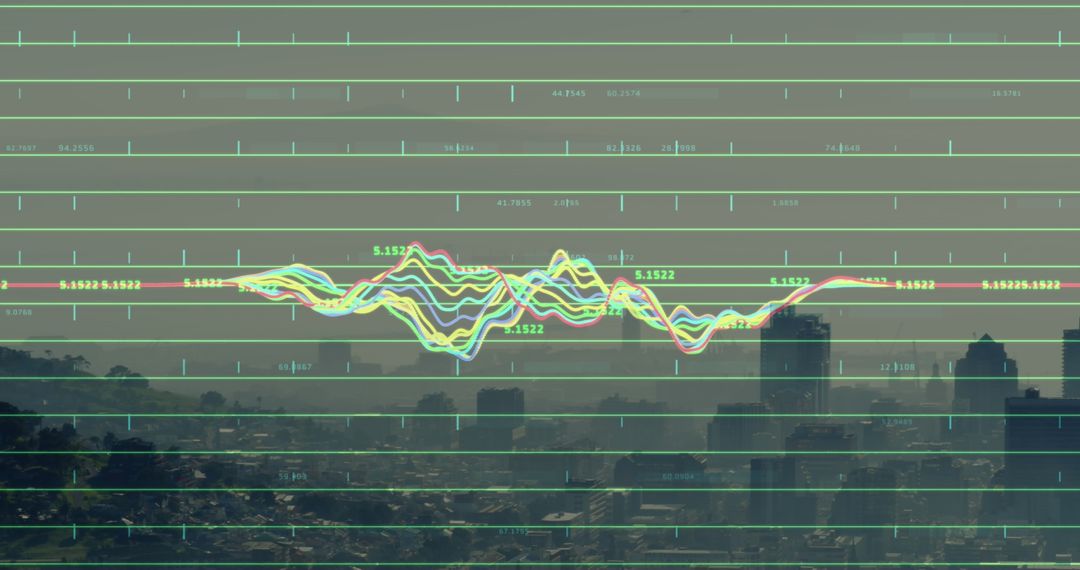
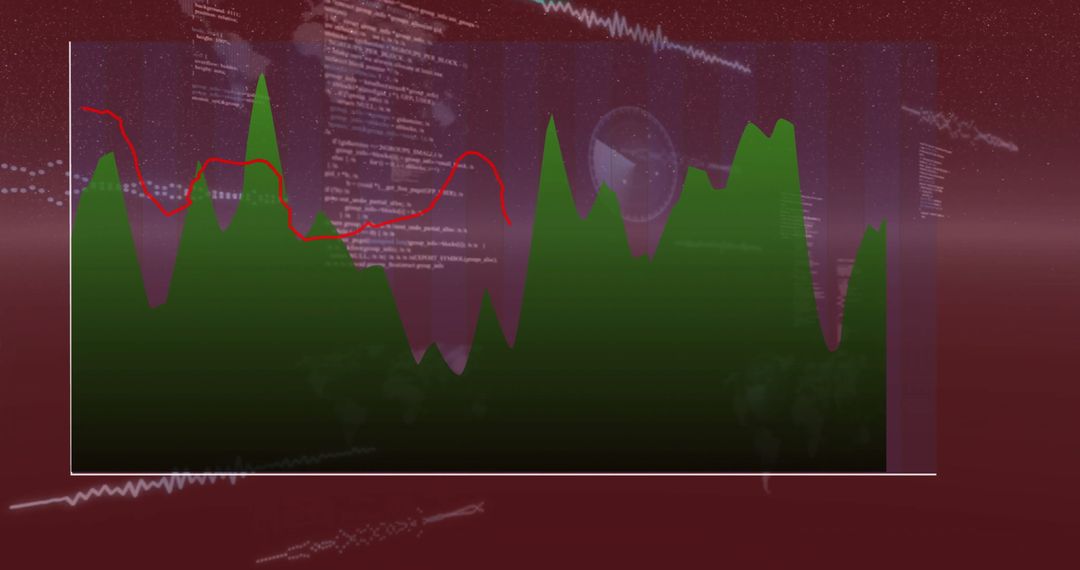
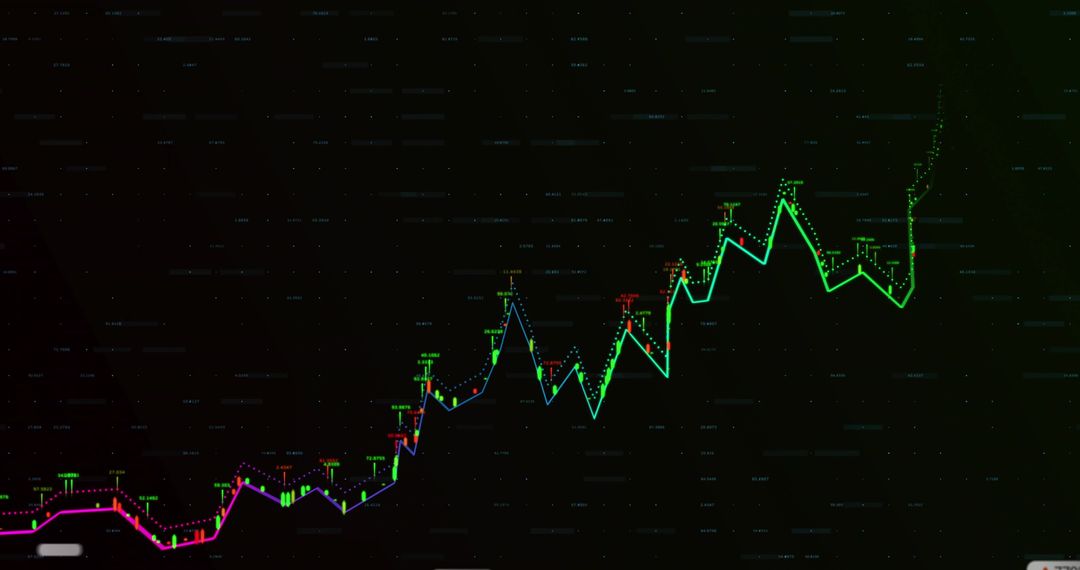
- Futuristic Multicolored Line Chart on Digital Dashboard
Futuristic Multicolored Line Chart on Digital Dashboard Image

Presents a vibrant scene of multicolored lines representing market trends against an innovative digital dashboard. Ideal for illustrating concepts related to financial technology, data analytics, and stock market forecasts. Useful for business presentations, tech blogs on market insights, and tutorials on data visualization techniques.
Powered by  - Get 15% off with code: PIKWIZARD15


2
downloads
downloads
Tags:
More
Credit Photo
If you would like to credit the Photo, here are some ways you can do so
Text Link
photo Link
<span class="text-link">
<span>
<a target="_blank" href=https://pikwizard.com/photo/futuristic-multicolored-line-chart-on-digital-dashboard/dc050139761dde73f22311062ee51ed0/>PikWizard</a>
</span>
</span>
<span class="image-link">
<span
style="margin: 0 0 20px 0; display: inline-block; vertical-align: middle; width: 100%;"
>
<a
target="_blank"
href="https://pikwizard.com/photo/futuristic-multicolored-line-chart-on-digital-dashboard/dc050139761dde73f22311062ee51ed0/"
style="text-decoration: none; font-size: 10px; margin: 0;"
>
<img src="https://pikwizard.com/pw/medium/dc050139761dde73f22311062ee51ed0.jpg" style="margin: 0; width: 100%;" alt="" />
<p style="font-size: 12px; margin: 0;">PikWizard</p>
</a>
</span>
</span>
Free (free of charge)
Free for personal and commercial use.
Author: Creative Art
Similar Free Stock Images