- Home >
- Stock Photos >
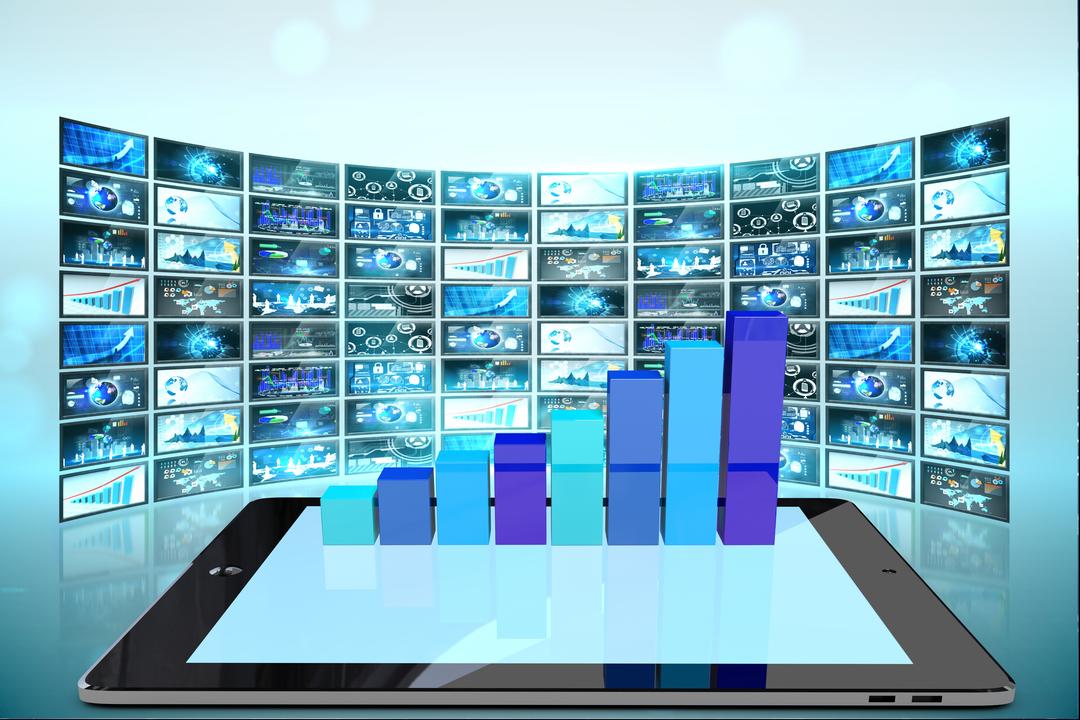
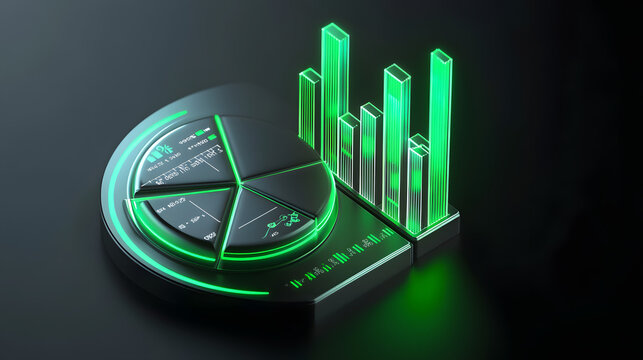
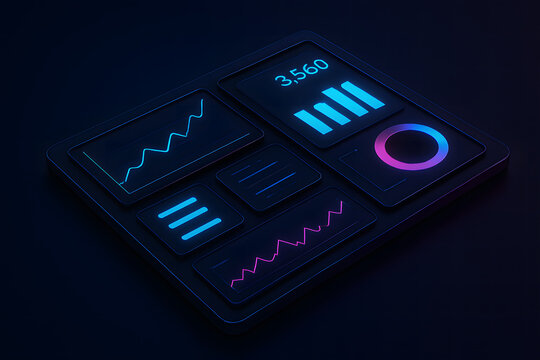
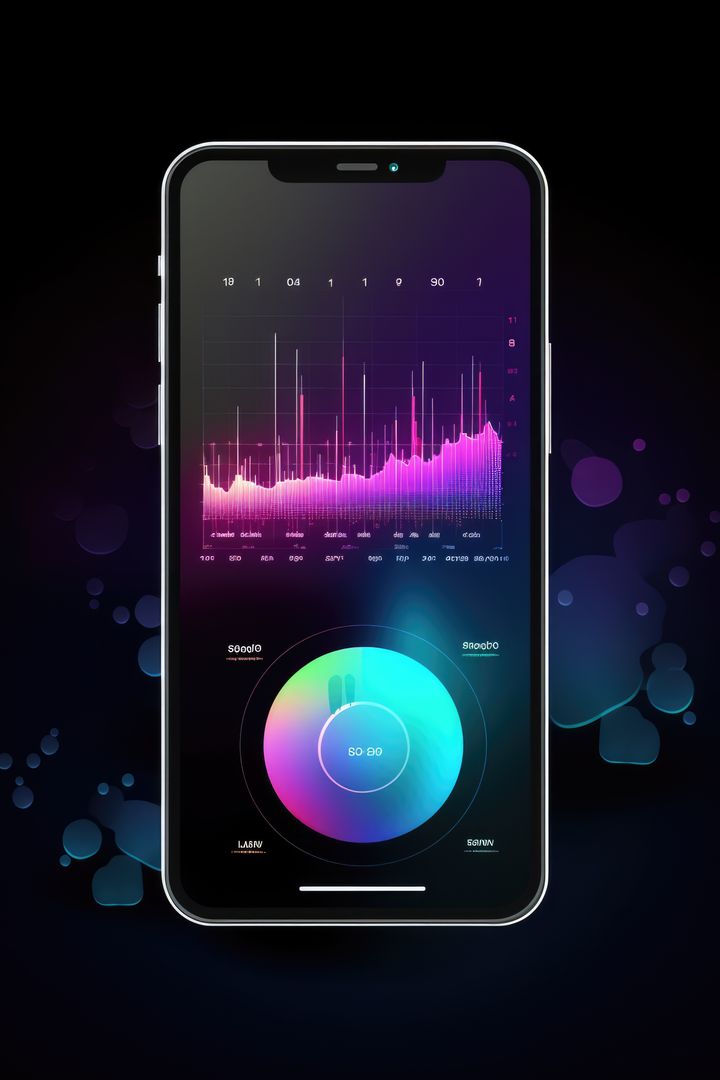
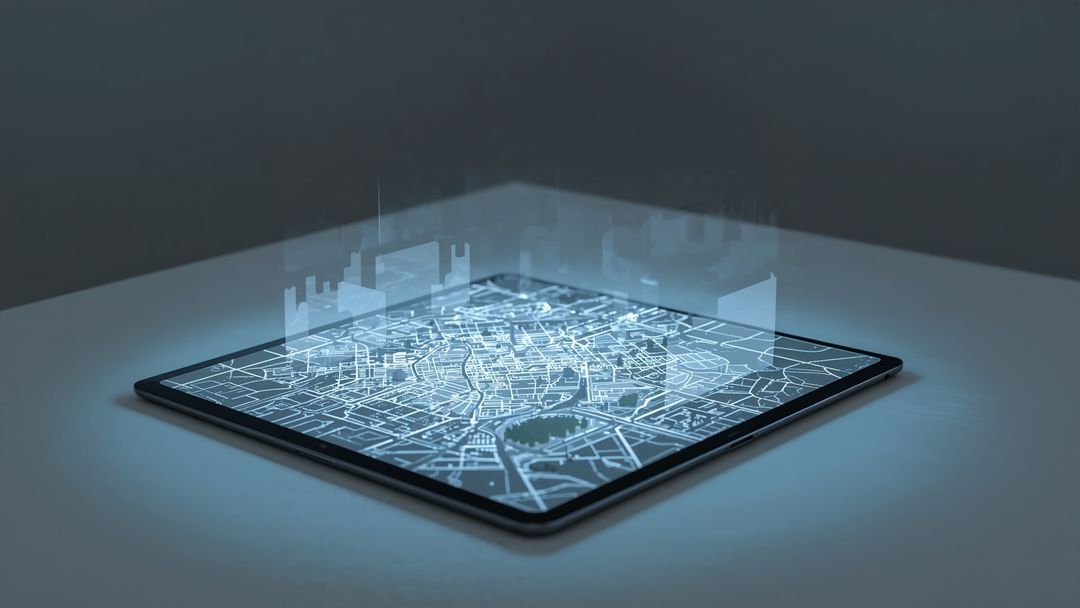
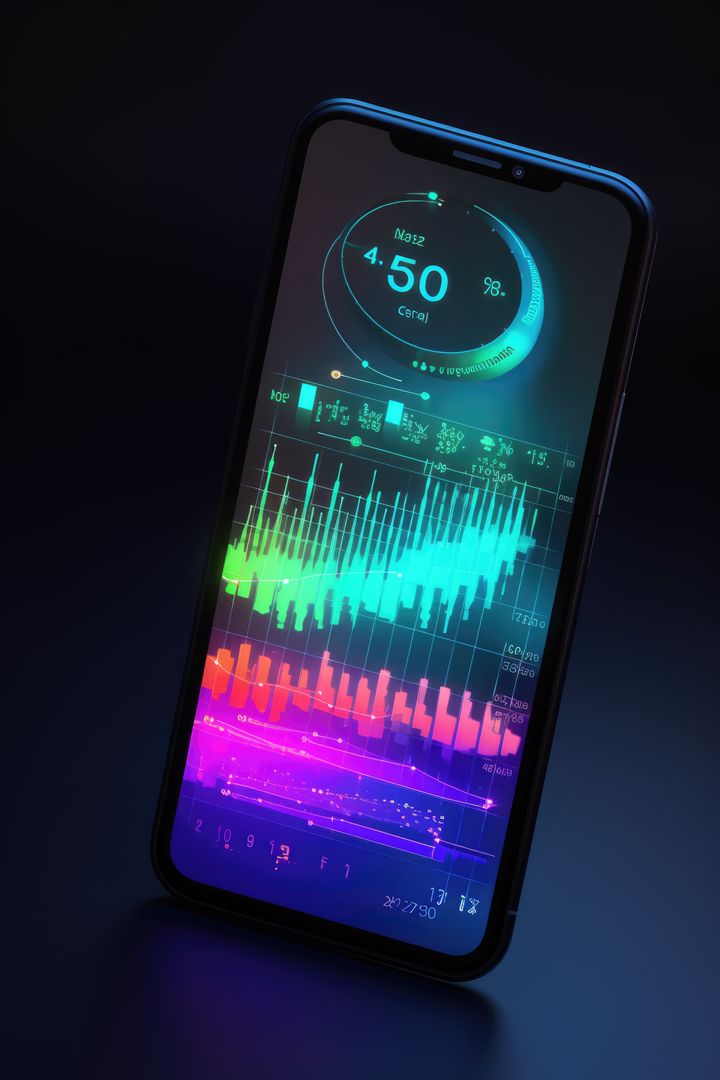
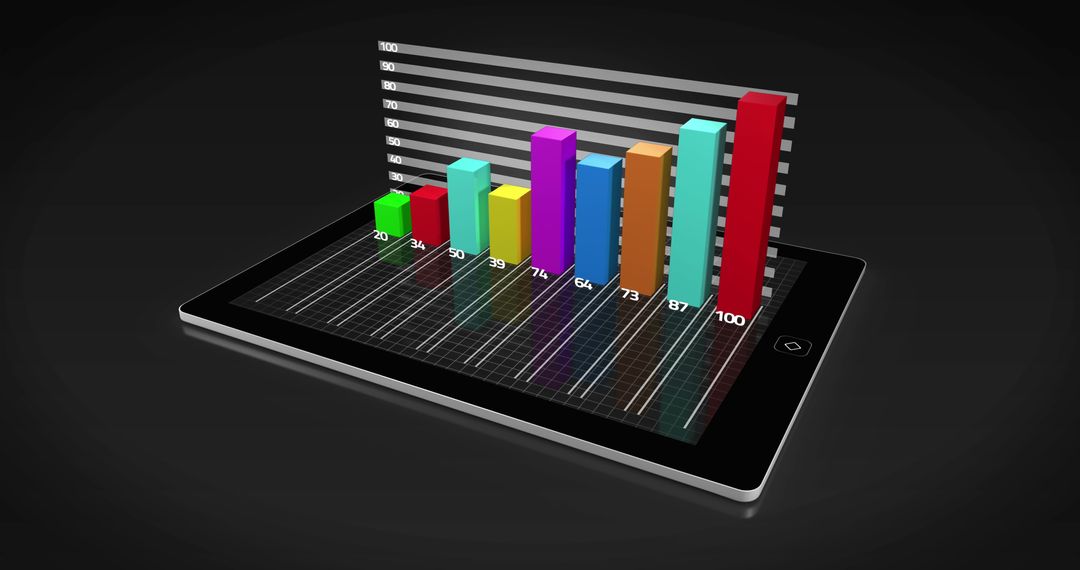
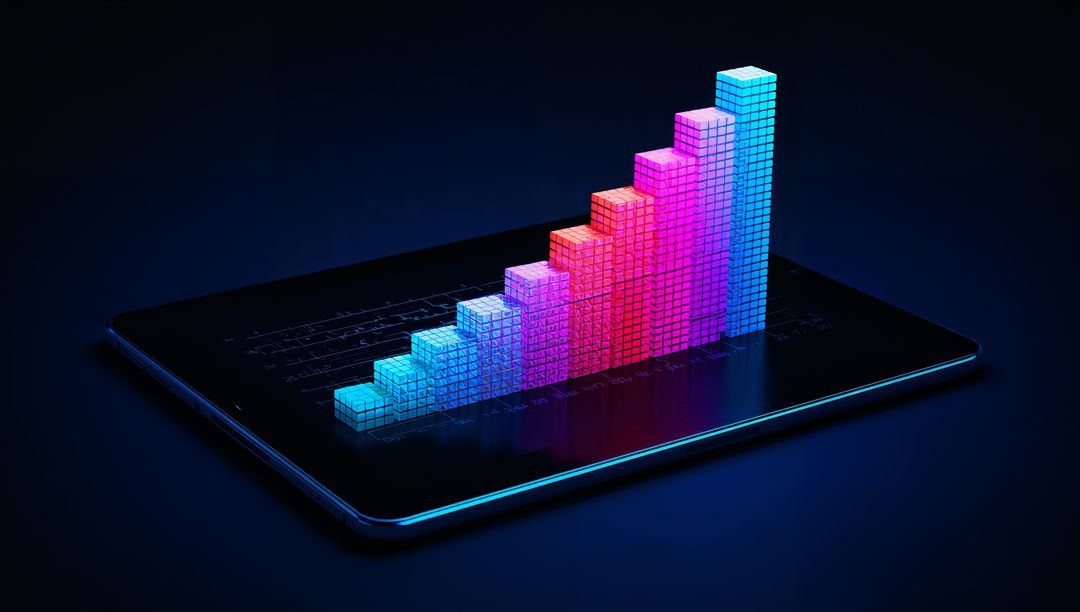
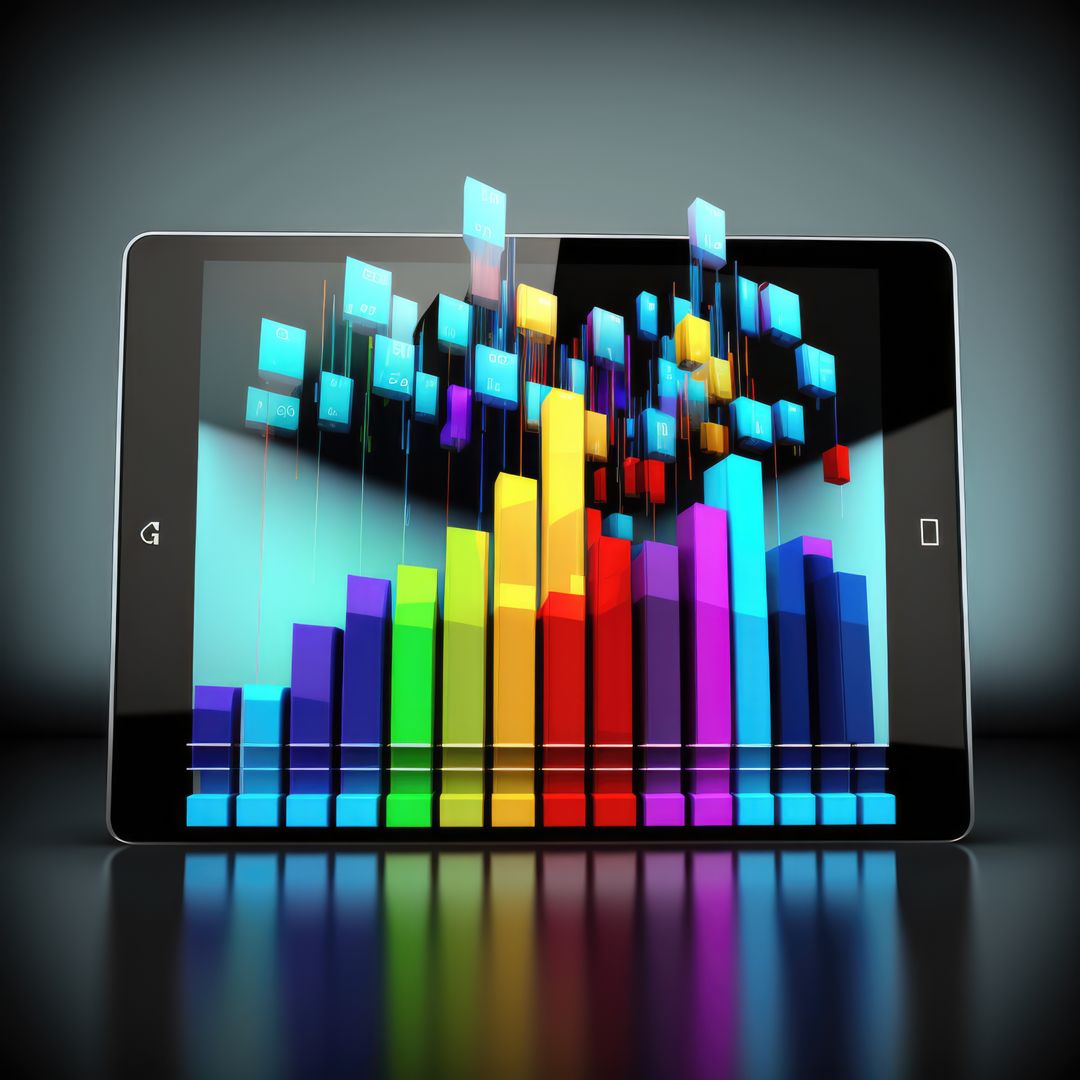
- Futuristic Neon 3D Bar Chart Emerging from Tablet
Futuristic Neon 3D Bar Chart Emerging from Tablet Image

AI Generated Image. Dynamic illustration of multi-colored neon 3D bar chart emerging from a tablet suggests advancement in data visualization and technology. Suited for presentations on digital transformation, futuristic analytics, and business intelligence. Ideal for articles addressing cutting-edge technology trends, and digital analytics demo material.
Powered by 


0
downloads
downloads
Tags:
More
Credit Photo
If you would like to credit the Photo, here are some ways you can do so
Text Link
photo Link
<span class="text-link">
<span>
<a target="_blank" href=https://pikwizard.com/photo/futuristic-neon-3d-bar-chart-emerging-from-tablet/7e6de1428d74ddb5891a4f3198f0d77a/>PikWizard</a>
</span>
</span>
<span class="image-link">
<span
style="margin: 0 0 20px 0; display: inline-block; vertical-align: middle; width: 100%;"
>
<a
target="_blank"
href="https://pikwizard.com/photo/futuristic-neon-3d-bar-chart-emerging-from-tablet/7e6de1428d74ddb5891a4f3198f0d77a/"
style="text-decoration: none; font-size: 10px; margin: 0;"
>
<img src="https://pikwizard.com/pw/medium/7e6de1428d74ddb5891a4f3198f0d77a.jpg" style="margin: 0; width: 100%;" alt="" />
<p style="font-size: 12px; margin: 0;">PikWizard</p>
</a>
</span>
</span>
Free (free of charge)
Free for personal and commercial use.
Author: AI Creator
Similar Free Stock Images
Premium


Premium


Premium


Premium


Premium


Premium


Premium


Premium


Premium


Premium


Premium


Premium


Premium


Premium


Premium


Premium