- Home >
- Stock Photos >
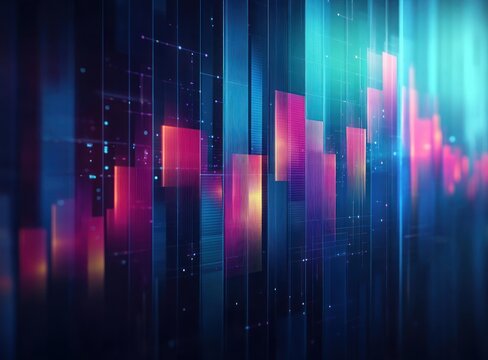
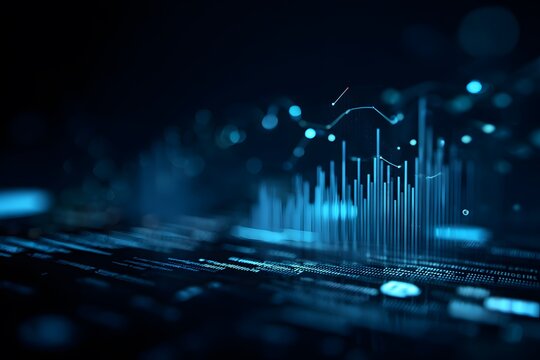
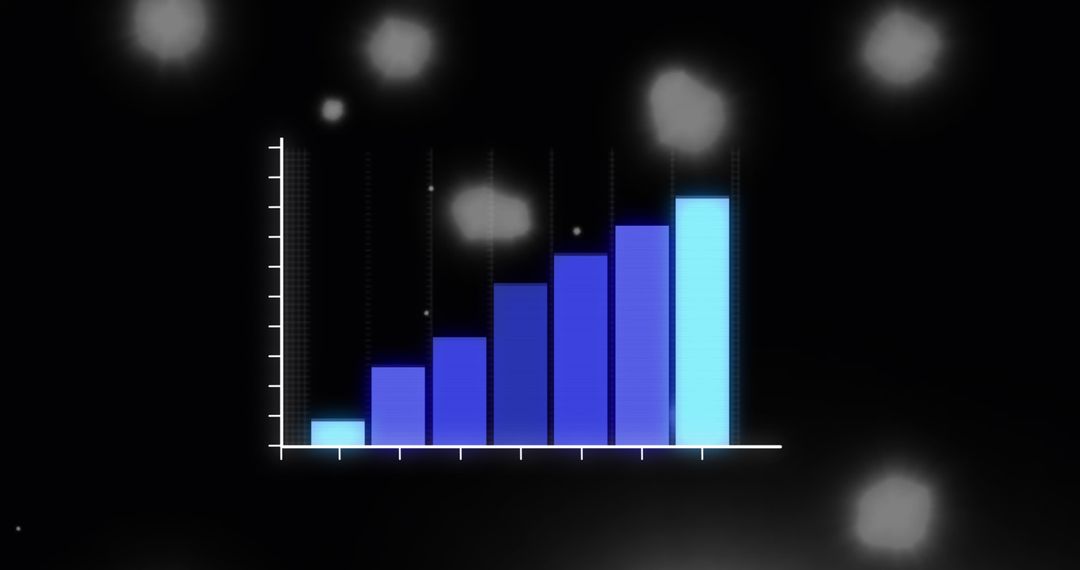
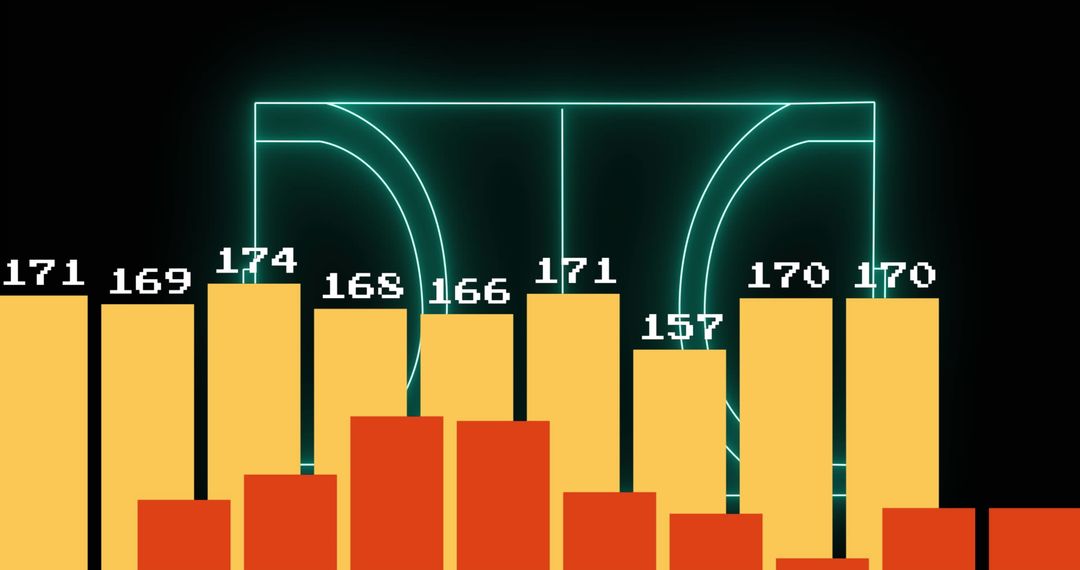
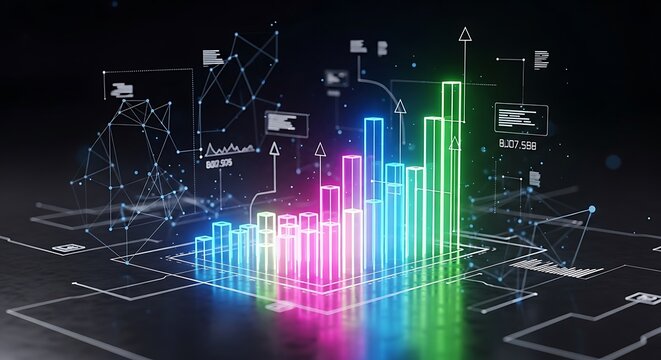
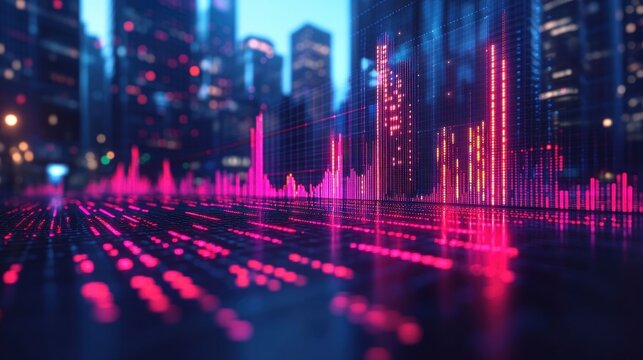
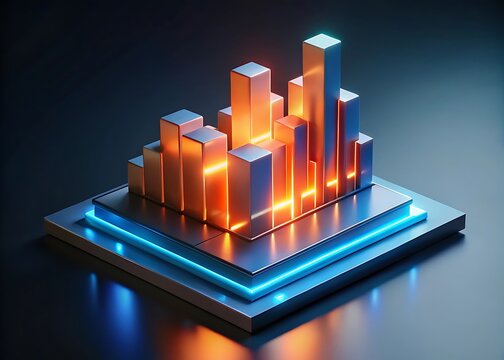
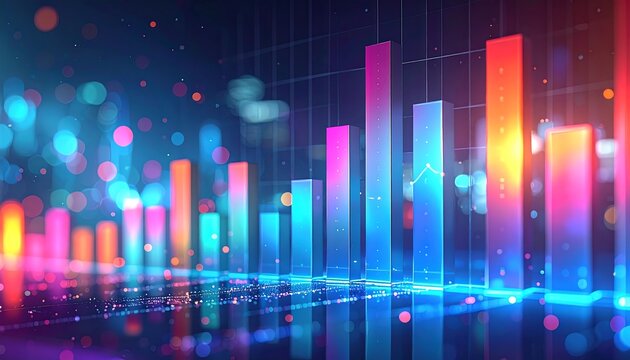
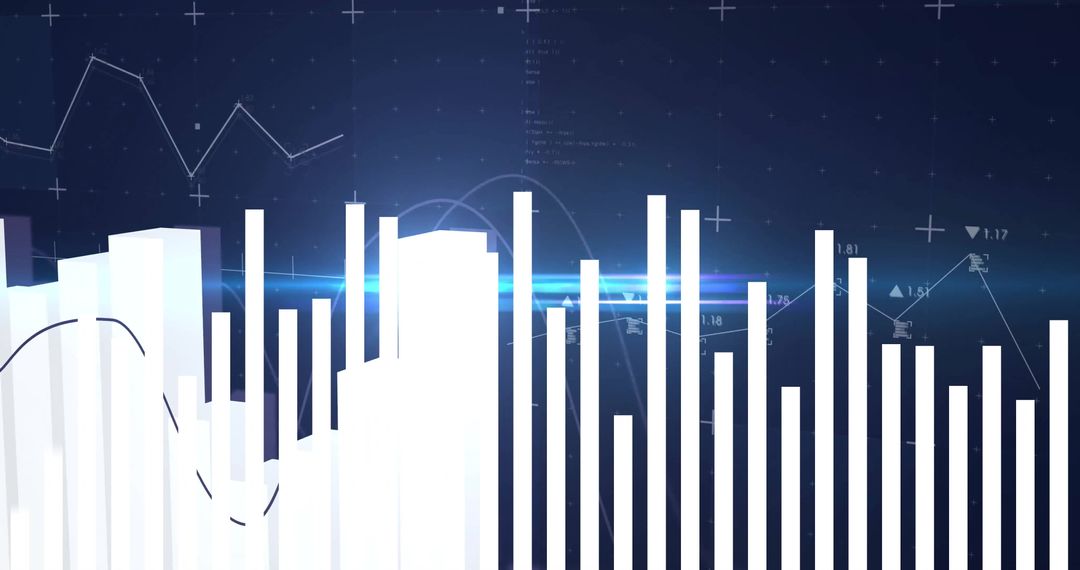
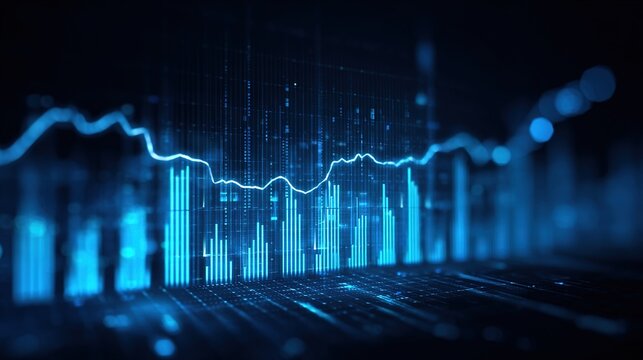
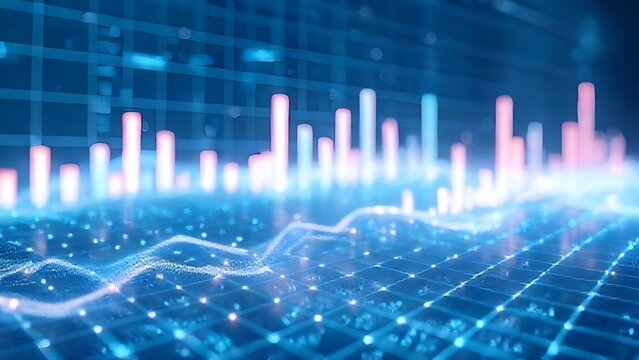
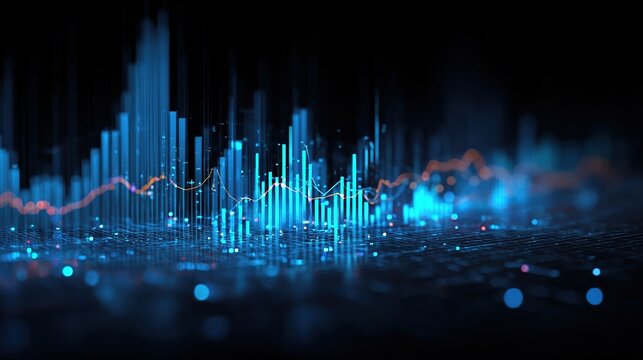
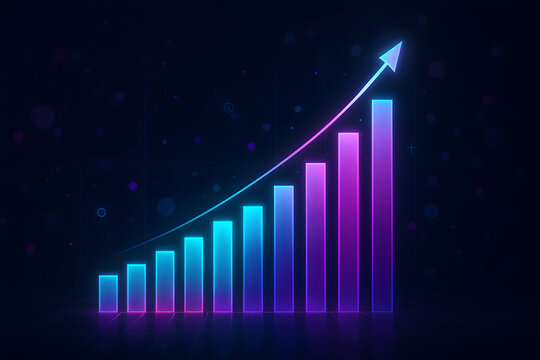
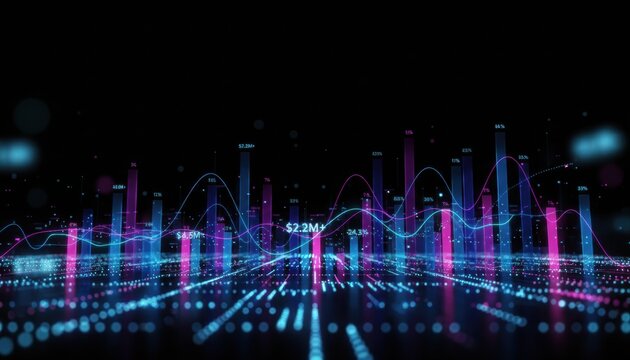
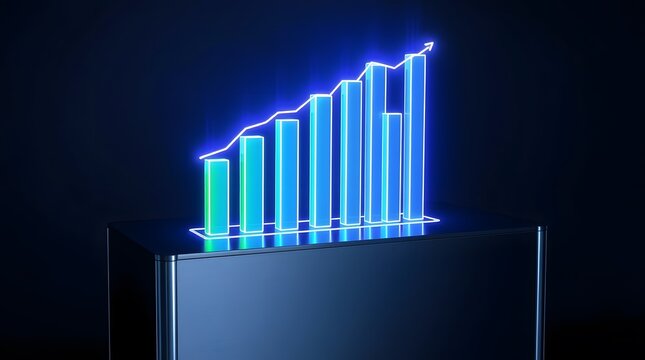
- Futuristic Neon Bar Chart on 3D Digital Grid
Futuristic Neon Bar Chart on 3D Digital Grid Image
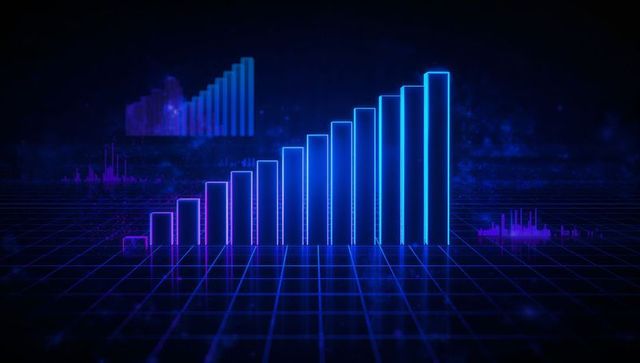
AI Generated Image. Glowing neon bar chart ascending on a dark 3D grid surface conveys futuristic data visualization. Filling the scene with a technology-themed atmosphere, images like this are ideal for designs involving digital analytics, AI, and financial growth presentations. The vibrant colors and luminous effect make it perfect for futuristic projects plugging financial trends, digital progress, tech innovations, and business transformations. Use for reports, websites, or promotional materials targeting audiences interested in modern technological advancements or analysis.
Powered by 


0
downloads
downloads
Tags:
More
Credit Photo
If you would like to credit the Photo, here are some ways you can do so
Text Link
photo Link
<span class="text-link">
<span>
<a target="_blank" href=https://pikwizard.com/photo/futuristic-neon-bar-chart-on-3d-digital-grid/deac042b6103d3b35d928a1b5a2e3fc3/>PikWizard</a>
</span>
</span>
<span class="image-link">
<span
style="margin: 0 0 20px 0; display: inline-block; vertical-align: middle; width: 100%;"
>
<a
target="_blank"
href="https://pikwizard.com/photo/futuristic-neon-bar-chart-on-3d-digital-grid/deac042b6103d3b35d928a1b5a2e3fc3/"
style="text-decoration: none; font-size: 10px; margin: 0;"
>
<img src="https://pikwizard.com/pw/medium/deac042b6103d3b35d928a1b5a2e3fc3.jpg" style="margin: 0; width: 100%;" alt="" />
<p style="font-size: 12px; margin: 0;">PikWizard</p>
</a>
</span>
</span>
Free (free of charge)
Free for personal and commercial use.
Author: AI Creator
Similar Free Stock Images
Premium


Premium


Premium


Premium


Premium


Premium


Premium


Premium


Premium


Premium

Premium


Premium


Premium


Premium


Premium


Premium


Premium


Premium


Premium


Premium


Premium


Premium
Premium

Premium