- Home >
- Stock Photos >
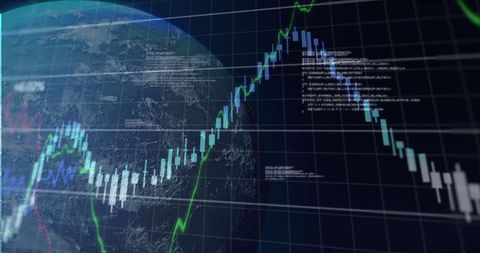
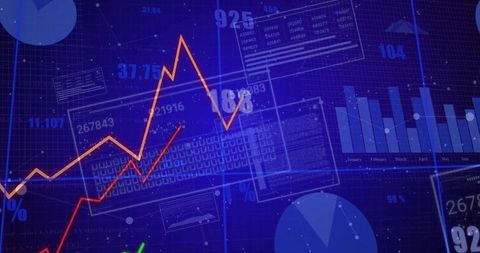
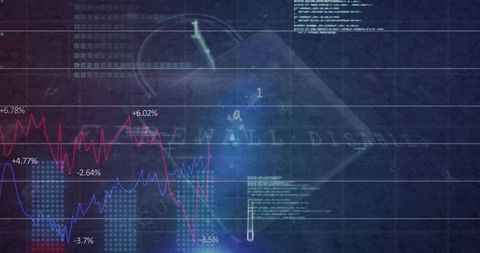
- Futuristic Neon Chart in Virtual Space with Code and Candlestick Bars
Futuristic Neon Chart in Virtual Space with Code and Candlestick Bars Image

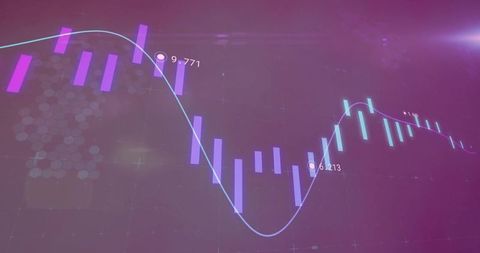
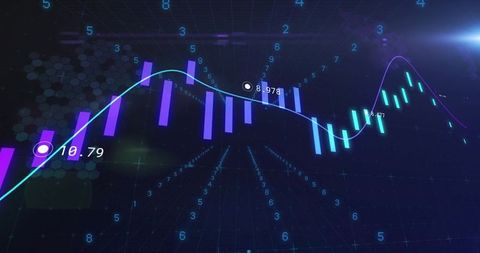
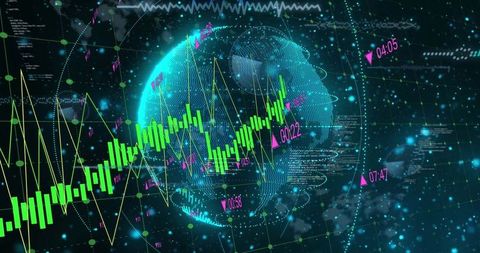
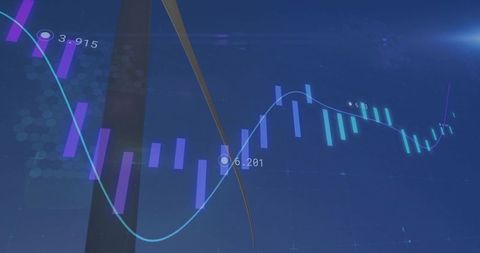
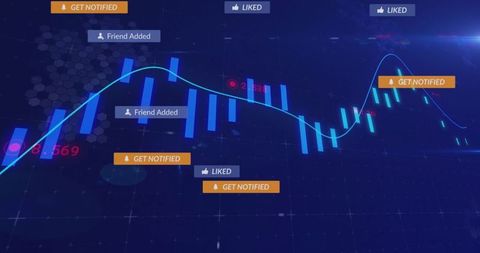
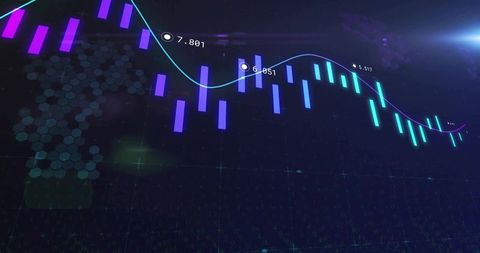
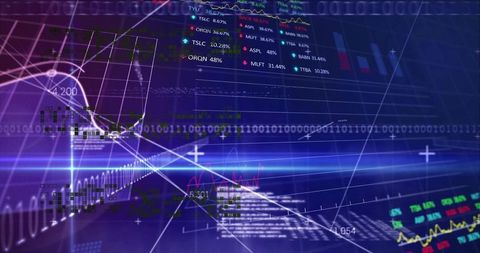
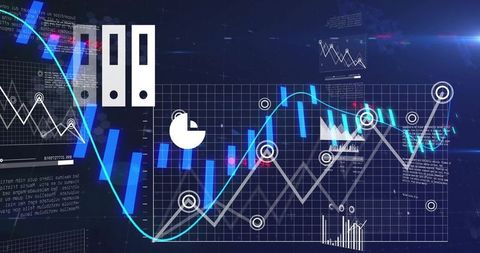
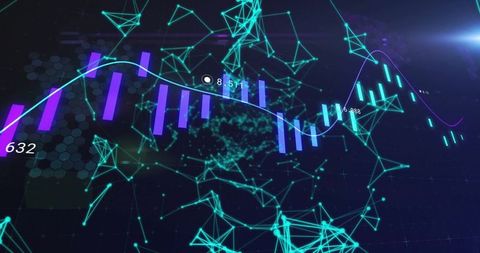
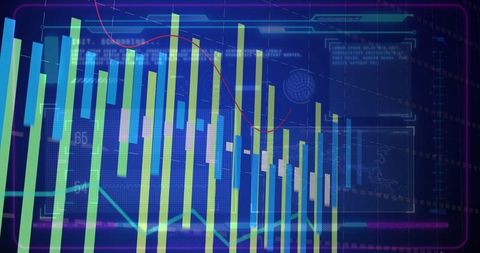
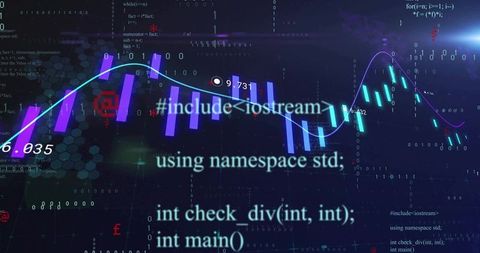
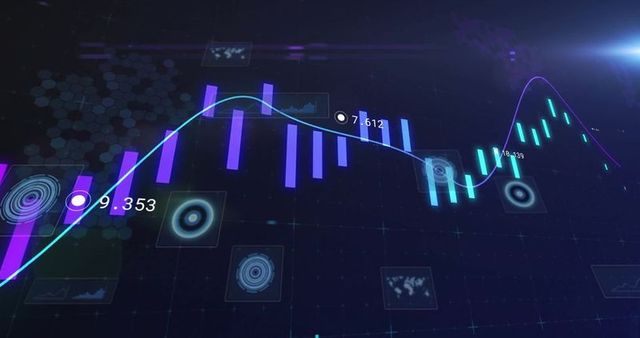
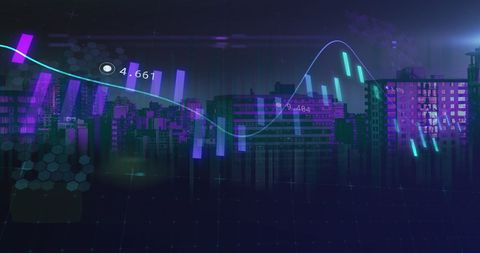
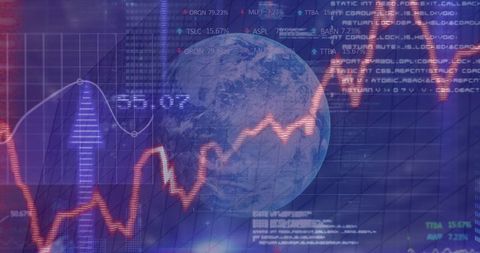
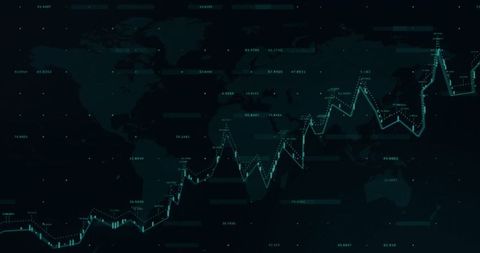
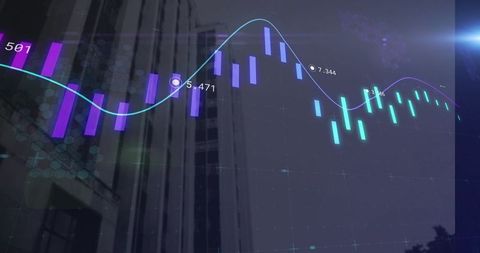
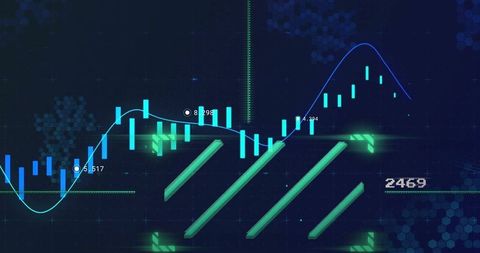
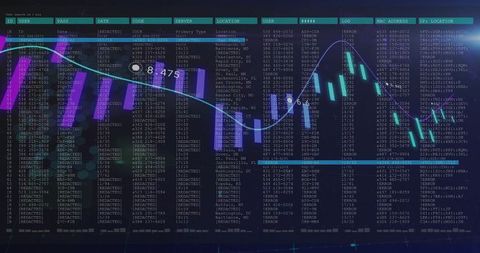
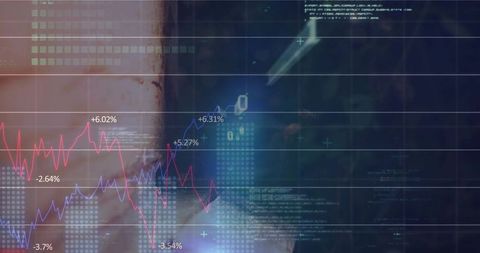
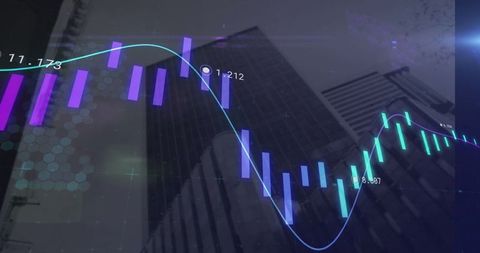
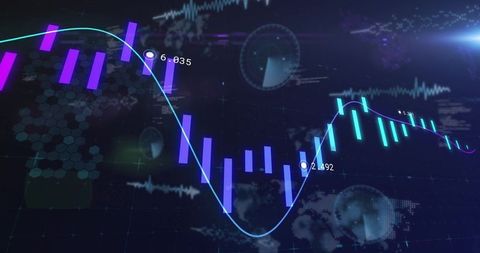
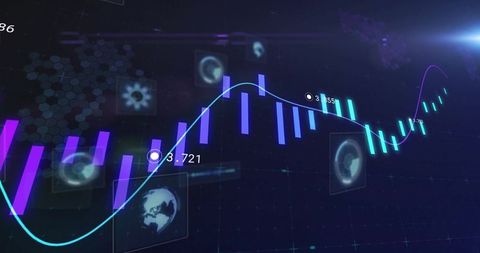
This image represents modern technology and digital advancements with a focus on data visualization. Neon lines and candlestick bars suggest financial analytics or technological data analysis. Use in presentations or articles related to finance, high-tech enterprise, or computer science, demonstrating a sense of futuristic data management and analytics ambiance.

downloads
Tags:
More
Credit Photo
If you would like to credit the Photo, here are some ways you can do so
Text Link
photo Link
<span class="text-link">
<span>
<a target="_blank" href=https://pikwizard.com/photo/futuristic-neon-chart-in-virtual-space-with-code-and-candlestick-bars/74e100d673e81c6b71810fdb80188c77/>PikWizard</a>
</span>
</span>
<span class="image-link">
<span
style="margin: 0 0 20px 0; display: inline-block; vertical-align: middle; width: 100%;"
>
<a
target="_blank"
href="https://pikwizard.com/photo/futuristic-neon-chart-in-virtual-space-with-code-and-candlestick-bars/74e100d673e81c6b71810fdb80188c77/"
style="text-decoration: none; font-size: 10px; margin: 0;"
>
<img src="https://pikwizard.com/pw/medium/74e100d673e81c6b71810fdb80188c77.jpg" style="margin: 0; width: 100%;" alt="" />
<p style="font-size: 12px; margin: 0;">PikWizard</p>
</a>
</span>
</span>
Free (free of charge)
Free for personal and commercial use.
Author: Authentic Images