- Home >
- Stock Photos >
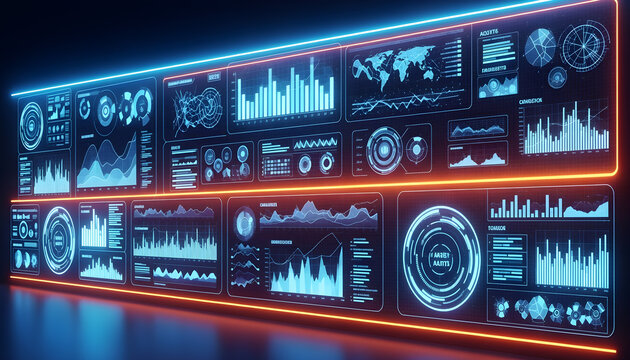
- Futuristic Neon Data Dashboard with Vibrant Analytics Tooltip
Futuristic Neon Data Dashboard with Vibrant Analytics Tooltip Image

This visual showcases a neon data chart on a dark background. Perfect for use in articles about high-tech innovations, data analytics, cyberpunk aesthetics, or technology-focused visualizations. Add to website blog posts, fintech dashboards, or presentations about digital transformation.
Powered by 


downloads
Tags:
More
Credit Photo
If you would like to credit the Photo, here are some ways you can do so
Text Link
photo Link
<span class="text-link">
<span>
<a target="_blank" href=https://pikwizard.com/photo/futuristic-neon-data-dashboard-with-vibrant-analytics-tooltip/e42838786ec99b7b0ef15251ee9e80d5/>PikWizard</a>
</span>
</span>
<span class="image-link">
<span
style="margin: 0 0 20px 0; display: inline-block; vertical-align: middle; width: 100%;"
>
<a
target="_blank"
href="https://pikwizard.com/photo/futuristic-neon-data-dashboard-with-vibrant-analytics-tooltip/e42838786ec99b7b0ef15251ee9e80d5/"
style="text-decoration: none; font-size: 10px; margin: 0;"
>
<img src="https://pikwizard.com/pw/medium/e42838786ec99b7b0ef15251ee9e80d5.jpg" style="margin: 0; width: 100%;" alt="" />
<p style="font-size: 12px; margin: 0;">PikWizard</p>
</a>
</span>
</span>
Free (free of charge)
Free for personal and commercial use.
Author: Awesome Content