1. Home > 
  2. Free Stock Photos & Images > 
  3. Futuristic Neon Data Waveforms and User Icon Network Grid for Analytics Dashboard Design

Futuristic Neon Data Waveforms and User Icon Network Grid for Analytics Dashboard Design Free Stock Image

Futuristic Neon Data Waveforms and User Icon Network Grid for Analytics Dashboard Design

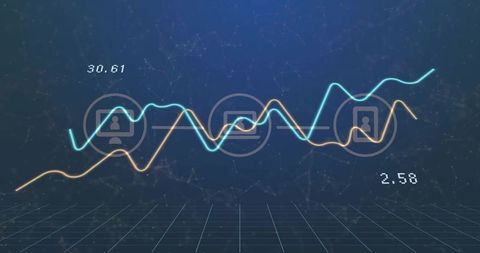
Featuring cyan and yellow neon waveforms on deep blue grid, conveying high-tech, data-driven connected network atmosphere. Using for analytics dashboard backgrounds, fintech platform interfaces, technology presentations, cybersecurity reports, investor pitch decks. Providing negative space for overlay text, charts, logo placement, and UI elements. Working well for hero banners, website headers, slide backgrounds, social media posts, and digital marketing collateral. Offering strong contrast for white or light-colored text and icons, supporting headline or call-to-action overlay. Serving print use in brochures, posters, trade show panels, and supporting motion graphics or animated banner sequences.

Powered by Shutterstock logo - Get 15% off with code: PIKWIZARD15
Business analytics dashboard concept with hands typing on laptop, digital financial charts and data visualization interface, performance metrics, market analysis, growth tracking and strategy insights - Powered by Shutterstock - Get 15% off with code: PIKWIZARD15Data analytics dashboard concept with business person using laptop, showing charts, graphs, and performance metrics for business intelligence and data driven decision making. - Powered by Shutterstock - Get 15% off with code: PIKWIZARD15A captivating image of a hand reaching toward data analytics concepts, highlighting cloud computing, statistics, and the power of big data in modern technology. Tessel - Powered by Shutterstock - Get 15% off with code: PIKWIZARD15Businessman analyzes an interactive data dashboard with bar charts, pie charts, KPI and visual reports to evaluate performance, support financial insights, and drive strategic business decisions. - Powered by Shutterstock - Get 15% off with code: PIKWIZARD15AI business intelligence interface featuring real-time AI data visualization, predictive AI model graphs, and automated report tools driven by AI artificial intelligence for business solution. Corpus - Powered by Shutterstock - Get 15% off with code: PIKWIZARD15

Credit Photo

If you would like to credit the Photo, here are some ways you can do so

Free (free of charge)

Free for personal and commercial use.

Author: Awesome Content

Similar Free Stock Images

Dynamic Financial Data Chart Visualization in Black Background
Futuristic 3D Financial Dashboard Displaying Neon Cyan Orange Line Charts with Grid View
Financial Graphs on Green Background Representing Market Trends
Abstract Financial Data Technology Background
Premium
Fluctuating Stock Market Graph with Dramatic Peaks
Futuristic Data Visualization on Global Map Interface
Visualizing Financial Data Trends Over Urban Backdrop
Dynamic Financial Data Analytics Display on Dark Background
Premium
Declining Stock Market Graph on Digital Background
Digital Financial Chart with Purple and Aqua Candlestick Bars
Data Processing Visualization with Cityscape Background
Global Business Dashboard Overlay on Urban Skyline Background
Premium
Dynamic Multicolored Waveforms in Digital Data Visualization
Financial Market Decline with Red Line Graph Overlay
Neon Green Line Graph Pulsing on Futuristic Blue Grid Dashboard for Data Analytics
Young professionals analyzing data visualization and brainstorming with sticky notes
Premium
Neon Line Charts Visualizing Market Data on Digital Grid Dashboard with Glow and Analytics
Candlestick Chart Displaying Market Trends with Analytical Lines
Bold red downtrend line graph showing sharp market decline on financial grid dashboard
Dynamic Stock Market Data Visualization on Digital Screen
Premium
Colorful Line Graphs with Candlestick Markers on Digital Interface
Dynamic Financial Growth Graph on Blue Grid Background
Futuristic Digital Waves Illustrating Complex Data Technology
Digital Financial Data Visualization over Circuit Board
Premium
Financial Data Analysis with Vibrant Lines on Blue Background
Digital Stock Market Graph with Dynamic Pink Line Trend
Neon waveform bundle oscillating across futuristic digital dashboard with grid and data markers
Colorful Neon Zigzag Vibrant Gradient Background
Premium
Dynamic Financial Data Charts on Dark Digital Background
Glowing Financial Graphs and Stock Market Analysis
Dynamic 3D Forex Line Graph on Digital Grid Display
Red Declining Graph on Digital Grid Display Represents Falling Markets
Premium
Displaying neon time series chart with yellow 3D wireframe cube and grid HUD
Futuristic Financial Data Analysis with Rising White Line Graph
Flowing Digital Data Wave with Grid on Gradient Background
Global Financial Data Visualization with Digital Overlays
Premium
Digital Stock Market Data Visualization in Server Room
Neon Market Lines Rising and Falling Over Urban Skyline Overlay for Finance Analytics
Neon Digital Data Dashboard with Interactive Analytics Interface
Digital Data Processing Background with Dynamic Lines
Premium
Dynamic Financial Graph with Rising Trend on Blue Background
Green Line Graph on Digital Grid Displaying Market Trends
Abstract neon waveform visualization with teal and gold curves on dark tech background
Dynamic Financial Data Visualization with Abstract Graph
Premium
Dynamic Financial Chart on Futuristic Digital Interface
Futuristic Data Analytics Concept with Glowing Line Graph
Fluctuating Graph on Green Grid Background Illustrating Financial Trends
Futuristic Financial Data Visualization with Neon Line Charts and Vertical Bar Graphs
Premium
Dynamic Financial Data Analysis Concept with Graph Lines and Orange Background
Abstract Digital Interface with Fluctuating Line Graph
Futuristic Neon Line Graphs Weaving Over Perspective Grid Dashboard for Fintech Analytics
Red Trend Line Fluctuating on Digital Chart Grid
Premium
AI
Blue Market Analysis Chart Showing Layered Trend Lines, Rising Growth, Highlighted Dots
Futuristic Waveform Dashboard with Digital Tech Icons
Financial Data Processing with Rising Graphs
Animated Financial Data with Heartbeat Overlapping Lines
Premium
Futuristic Analytics Graph with Cyan-Orange Line Trends
Futuristic Data Analysis with Digital Graphs on Gradient
Dynamic Financial Data Analytics Interface with Blue Background
Dynamic Multicolored Graphs on Abstract Digital Finance Background
Premium
Financial Market Chart on Digital Screen Showing Growing Trends
Financial Data Analysis with Declining Trend on Blueprint Graph
Neon Candlestick Chart With Glowing Spline and Numeric Tickers Overlaid on Cityscape
Dynamic Data Processing with Global Digital Interface Elements
Premium
Colorful Light Trails over Digital Data on Dark Background
Dynamic Data Graphs Display on Dark Digital Background
Digital Charts and Financial Data Background in Blue Tones
Digital DNA Strand Over Global Map Representing Data Transmission
Premium
Cyan Candlestick Chart Recovering on Halftone Mesh for Financial Data Visualization
Dynamic Financial Market Trends with Data Visualizations
Futuristic Data Dashboard with Colorful Line Graphs
Abstract Data Analysis Over Digital Interface
Premium
Financial Growth Arrows on Digital Grid Base
Orange Graph Line and Candlestick Chart Over City Skyline
Futuristic Digital Dashboard with Neon Line Charts Analysis
Urban Skyline with Financial Growth Chart Overlay
Premium
Financial Data Analysis with Complex Graphs and Charts
Futuristic Financial Analytics Showing Neon Line Graphs Over 3D Grid With Globe and Data Labels
Neon Red Volatile Line Chart on Deep Blue Data Dashboard with Numeric Metrics
Neon pink jagged growth line over hazy city skyline with teal grid data visualization dashboard
Premium
Financial Graph with Line Trending Upwards on Navy Background
Neon Infinity Symbol Overlaying Financial Statistics Background
Neon candlestick market chart with orange trend line, numeric data overlay on navy screen
Holographic Neon Trend Lines Dashboard Showing Cyan and Orange Data Waves Over Grid
Premium
Digital Data Interface on Car Panel with Financial Trends
Dynamic Digital Financial Data Interface Background
Abstract Financial Graph on Dark Digital Background
Colorful Financial Chart with Heart Icons on Blue Background
Premium
Financial Data Displayed with Trends on Blue Background
Digital Financial Analytics in Modern Server Room Environment
Cyber Security with Data Wave and Digital Padlock Scanner
Analytics Dashboard with Dynamic Financial Data Visualization
Premium
Declining Graph Overlay on Night Traffic Scene Illustrates Downtrend
AI
Financial Candlestick Chart Showing Upward Trend with Layered Bands and Moving Average
Cityscape Blended with Graphs Showing Finance Trends
Surprising Drop in Digital Stock Market Chart Visualization
Premium
Vibrant Waveforms on Digital Technological Background
Global Data Processing Over Interactive World Map
Dynamic Financial Data Visualization with Blue Trends
Neon trading dashboard plotting candlestick bars and smooth trend lines on hexagon tessellation
Premium
Explore More Free Stock Images