- Home >
- Stock Photos >
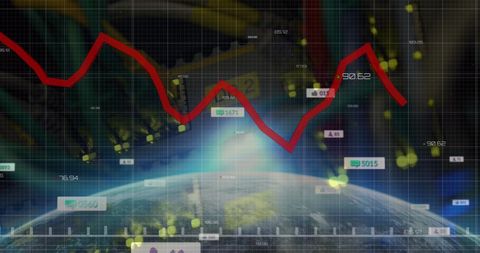
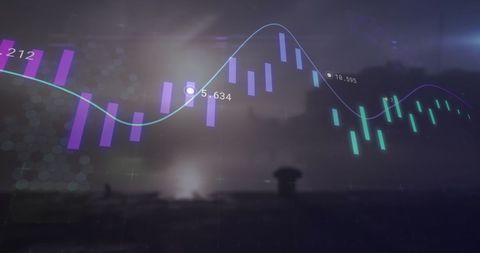
- Futuristic Neon Financial Dashboard with Candlestick Chart, Purple Cyan Bars and HUD
Futuristic Neon Financial Dashboard with Candlestick Chart, Purple Cyan Bars and HUD Image

Featuring neon purple and cyan candlesticks over dark grid with flowing trend lines, numerical markers, and HUD overlays. Creating high-tech futuristic mood for financial technology and trading projects. Working well for fintech website hero banners, trading platform dashboards, investor pitch decks, market analysis reports, social media ads, conference visuals, and blog headers. Allowing easy cropping for widescreen banners or square social posts while keeping key data readable. Supplying strong visual contrast for overlaying headlines, logos, or animated data elements in post-production. Color palette focusing on deep navy background with neon purple and cyan accents and subtle lens flare highlights.
Powered by 


0
downloads
downloads
Tags:
More
Credit Photo
If you would like to credit the Photo, here are some ways you can do so
Text Link
photo Link
<span class="text-link">
<span>
<a target="_blank" href=https://pikwizard.com/photo/futuristic-neon-financial-dashboard-with-candlestick-chart-purple-cyan-bars-and-hud/1104b1df6fe8ab41307756d81932a35c/>PikWizard</a>
</span>
</span>
<span class="image-link">
<span
style="margin: 0 0 20px 0; display: inline-block; vertical-align: middle; width: 100%;"
>
<a
target="_blank"
href="https://pikwizard.com/photo/futuristic-neon-financial-dashboard-with-candlestick-chart-purple-cyan-bars-and-hud/1104b1df6fe8ab41307756d81932a35c/"
style="text-decoration: none; font-size: 10px; margin: 0;"
>
<img src="https://pikwizard.com/pw/medium/1104b1df6fe8ab41307756d81932a35c.jpg" style="margin: 0; width: 100%;" alt="" />
<p style="font-size: 12px; margin: 0;">PikWizard</p>
</a>
</span>
</span>
Free (free of charge)
Free for personal and commercial use.
Author: People Creations
Similar Free Stock Images
Loading...

Premium


Premium


Premium

Premium


Premium


Premium

Premium


Premium


Premium


Premium


Premium


Premium


Premium

Premium


Premium


Premium


Premium


Premium
Premium


Premium


Premium


Premium


Premium


Premium


Premium