- Home >
- Stock Photos >
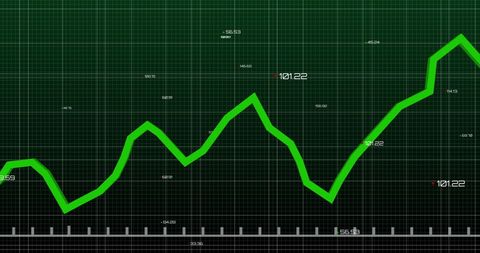
- Futuristic Neon Green Graph with Data Alerts
Futuristic Neon Green Graph with Data Alerts Image
Graphic features neon green line graph pulsating against dark backdrop, adorned with data callouts including map-pins, notifications, and chat icons. Ideal for presentations or websites on data analysis, technology, digital interaction, or futuristic themes. Enhances visual appeal in tech blogs, financial reports, marketing, and education materials.

downloads
Tags:
More
Credit Photo
If you would like to credit the Photo, here are some ways you can do so
Text Link
photo Link
<span class="text-link">
<span>
<a target="_blank" href=https://pikwizard.com/photo/futuristic-neon-green-graph-with-data-alerts/2308df3eafbf5d8367ced1733f6c08b7/>PikWizard</a>
</span>
</span>
<span class="image-link">
<span
style="margin: 0 0 20px 0; display: inline-block; vertical-align: middle; width: 100%;"
>
<a
target="_blank"
href="https://pikwizard.com/photo/futuristic-neon-green-graph-with-data-alerts/2308df3eafbf5d8367ced1733f6c08b7/"
style="text-decoration: none; font-size: 10px; margin: 0;"
>
<img src="https://pikwizard.com/pw/medium/2308df3eafbf5d8367ced1733f6c08b7.jpg" style="margin: 0; width: 100%;" alt="" />
<p style="font-size: 12px; margin: 0;">PikWizard</p>
</a>
</span>
</span>
Free (free of charge)
Free for personal and commercial use.
Author: People Creations