- Home >
- Stock Photos >
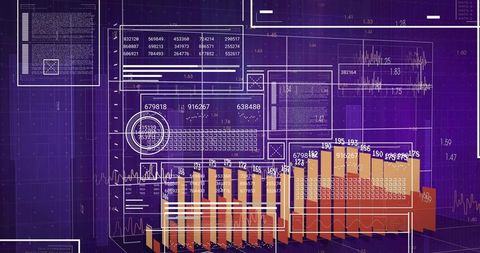
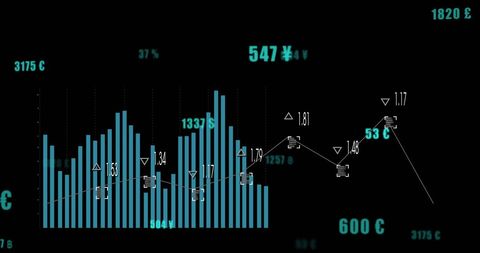
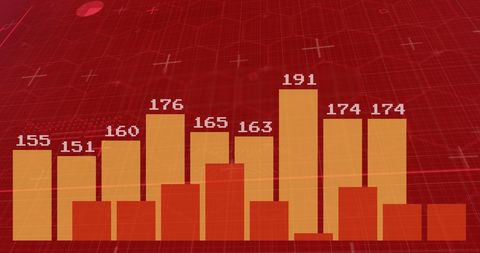
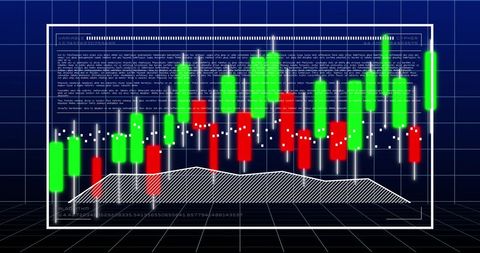
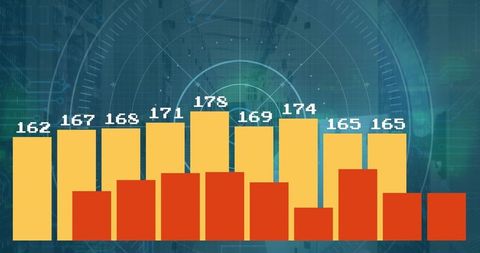
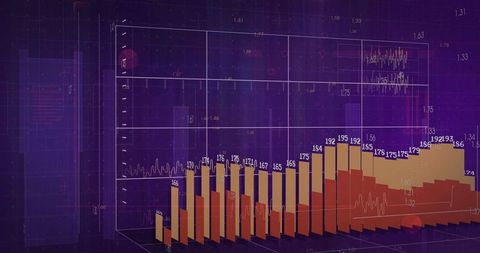
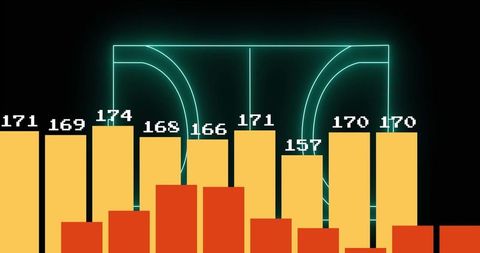
- Futuristic Neon-Infused Data Visualization with Bar Graphs
Futuristic Neon-Infused Data Visualization with Bar Graphs Image
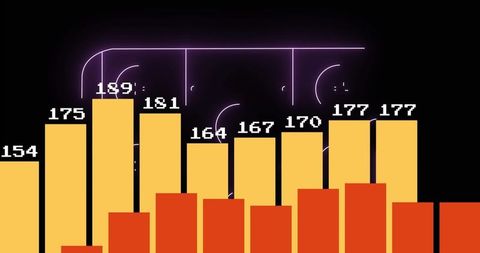
This image showcases a vibrant display of red and yellow bar graphs against a stark black background enhanced with neon purple circuit patterns. The vivid choice of colors aims to convey a modern, technology-driven theme suitable for representing analytics or statistical data. Ideal for presentations discussing futuristic topics, data analytics, digital tools, technology trends, or for enhancing the visual appeal of both digital and print materials focused on innovative solutions.

downloads
Tags:
More
Credit Photo
If you would like to credit the Photo, here are some ways you can do so
Text Link
photo Link
<span class="text-link">
<span>
<a target="_blank" href=https://pikwizard.com/photo/futuristic-neon-infused-data-visualization-with-bar-graphs/7073e5f3a36c51463efdbb311a90a142/>PikWizard</a>
</span>
</span>
<span class="image-link">
<span
style="margin: 0 0 20px 0; display: inline-block; vertical-align: middle; width: 100%;"
>
<a
target="_blank"
href="https://pikwizard.com/photo/futuristic-neon-infused-data-visualization-with-bar-graphs/7073e5f3a36c51463efdbb311a90a142/"
style="text-decoration: none; font-size: 10px; margin: 0;"
>
<img src="https://pikwizard.com/pw/medium/7073e5f3a36c51463efdbb311a90a142.jpg" style="margin: 0; width: 100%;" alt="" />
<p style="font-size: 12px; margin: 0;">PikWizard</p>
</a>
</span>
</span>
Free (free of charge)
Free for personal and commercial use.
Author: Creative Art