- Home >
- Stock Photos >
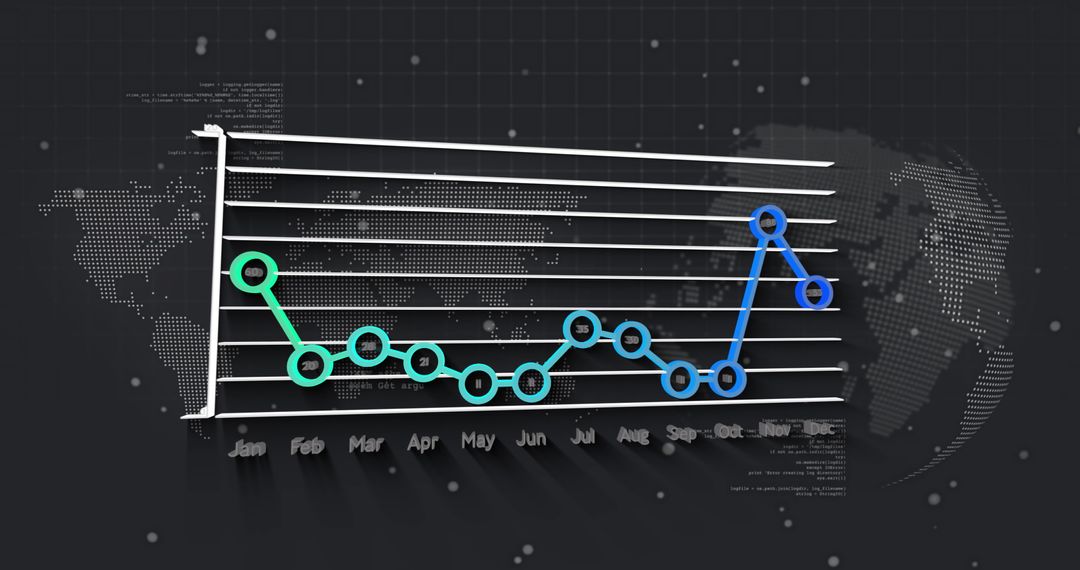
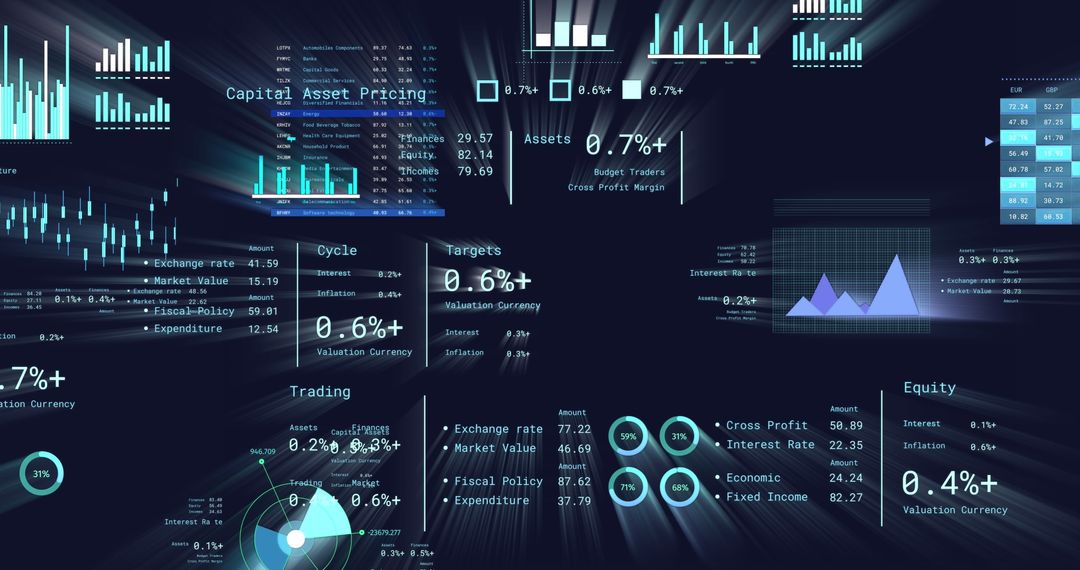
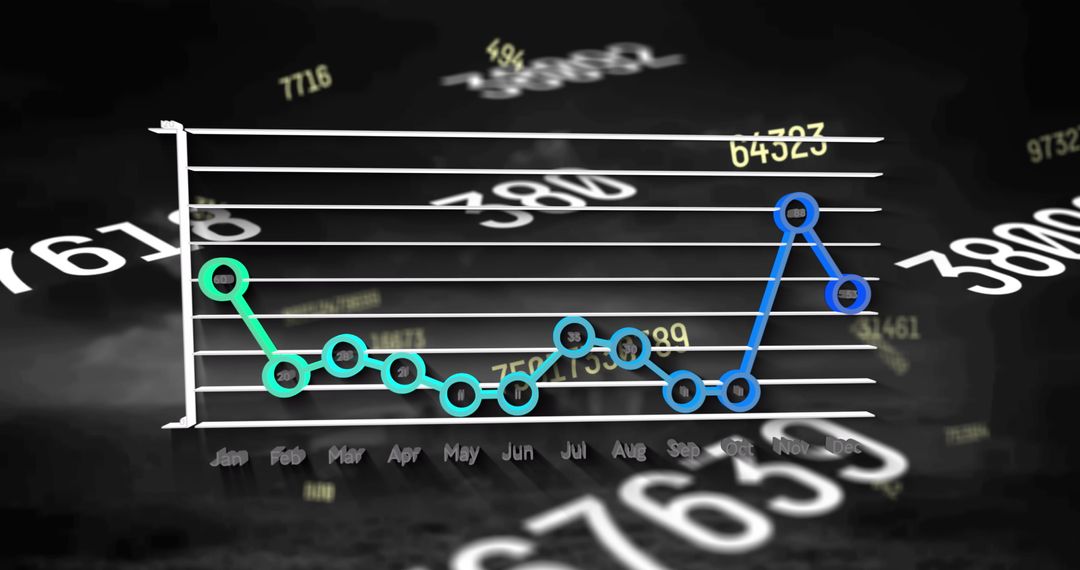
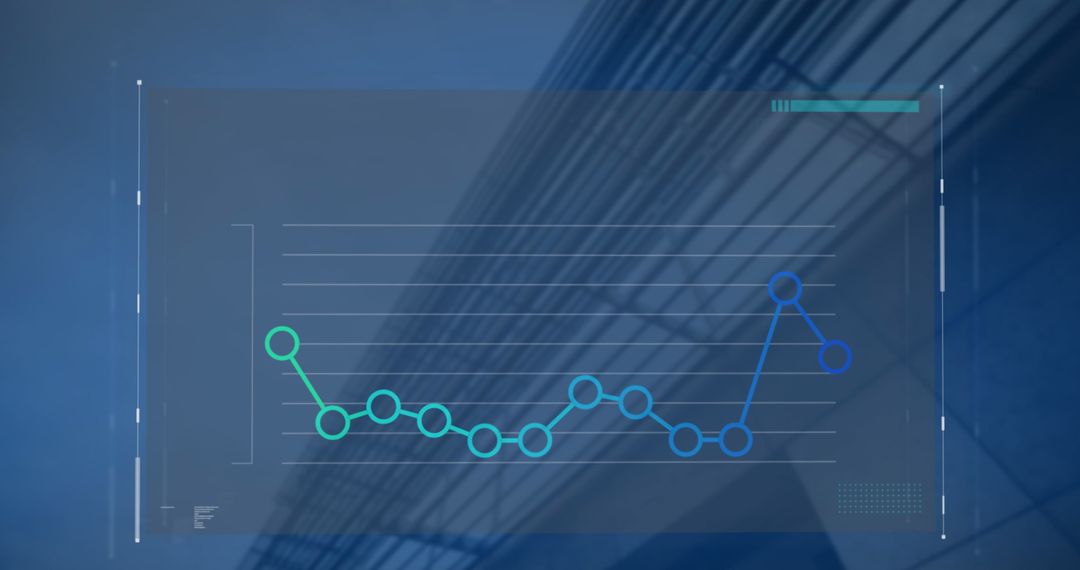
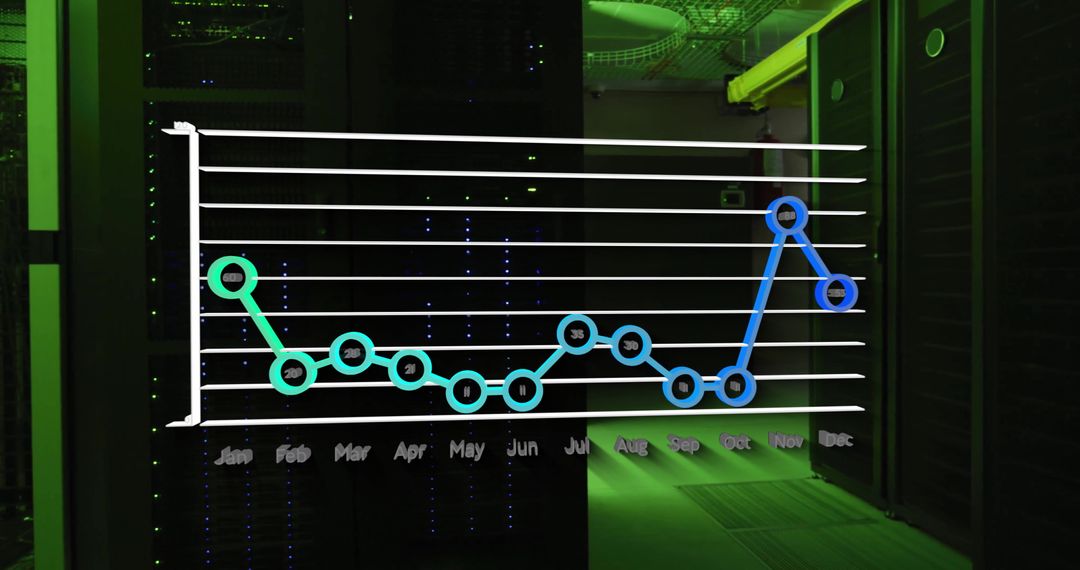
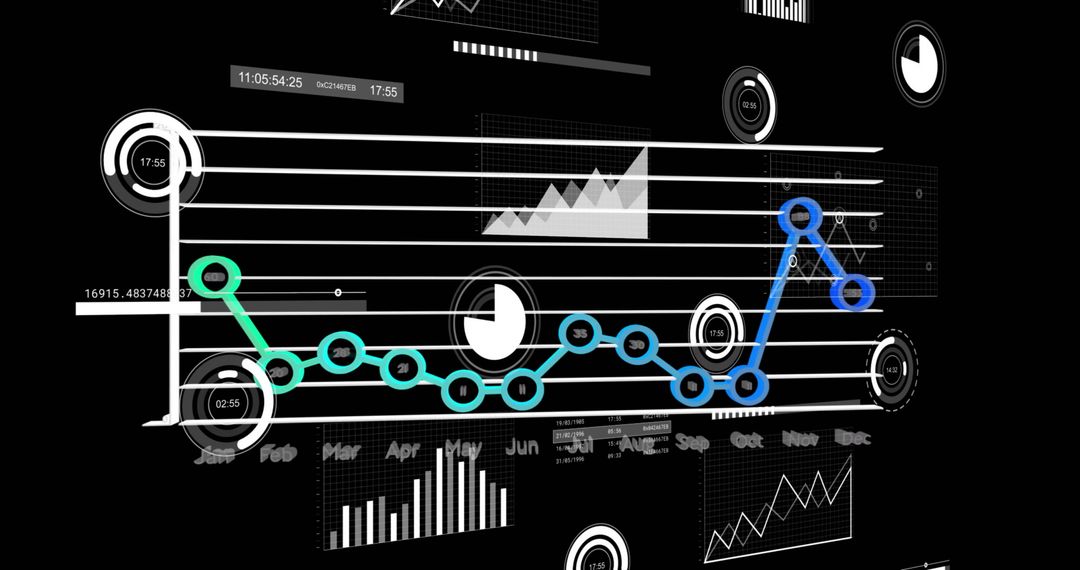
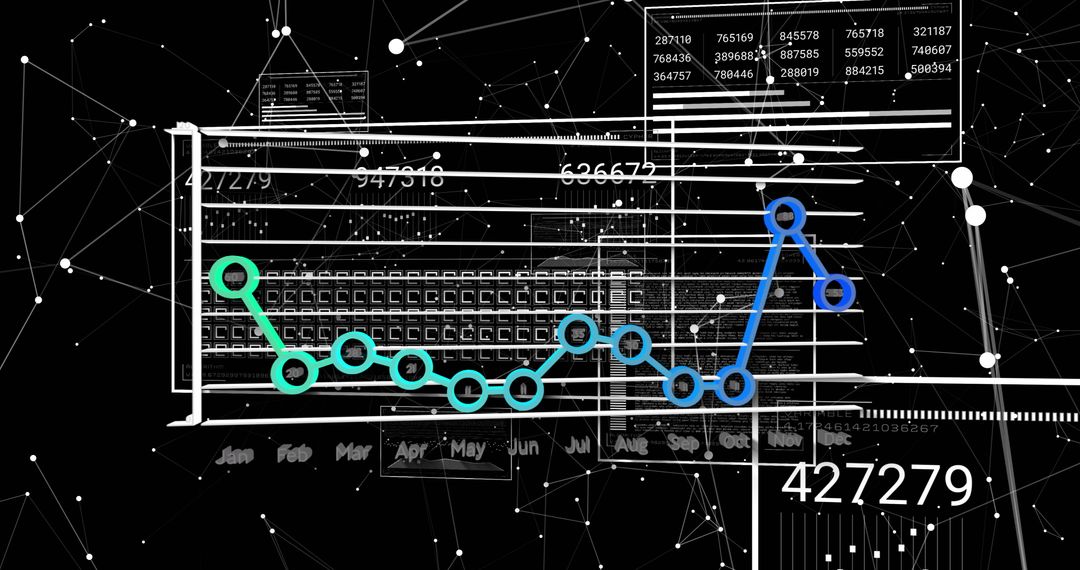
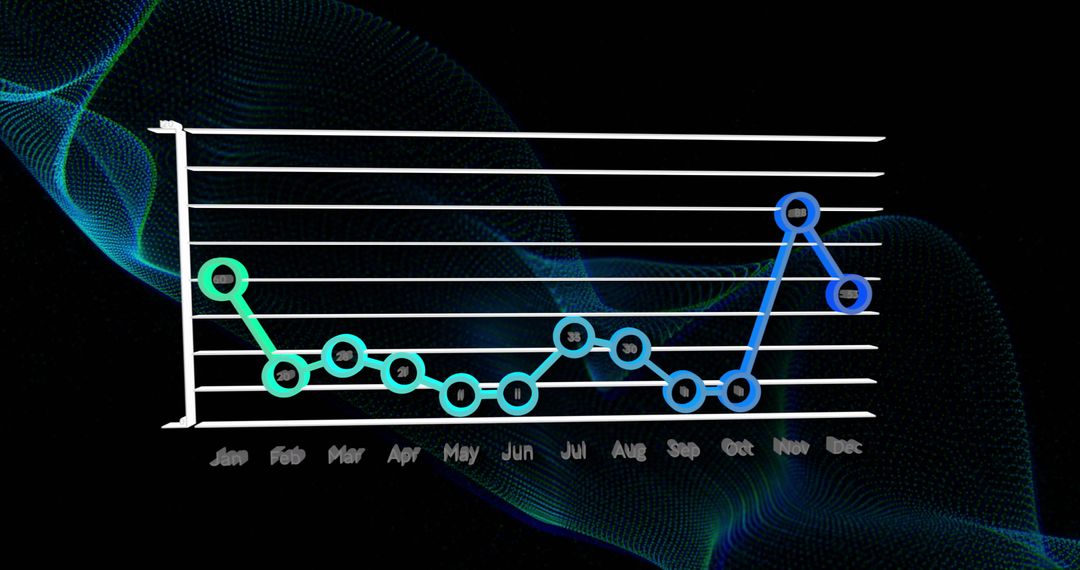
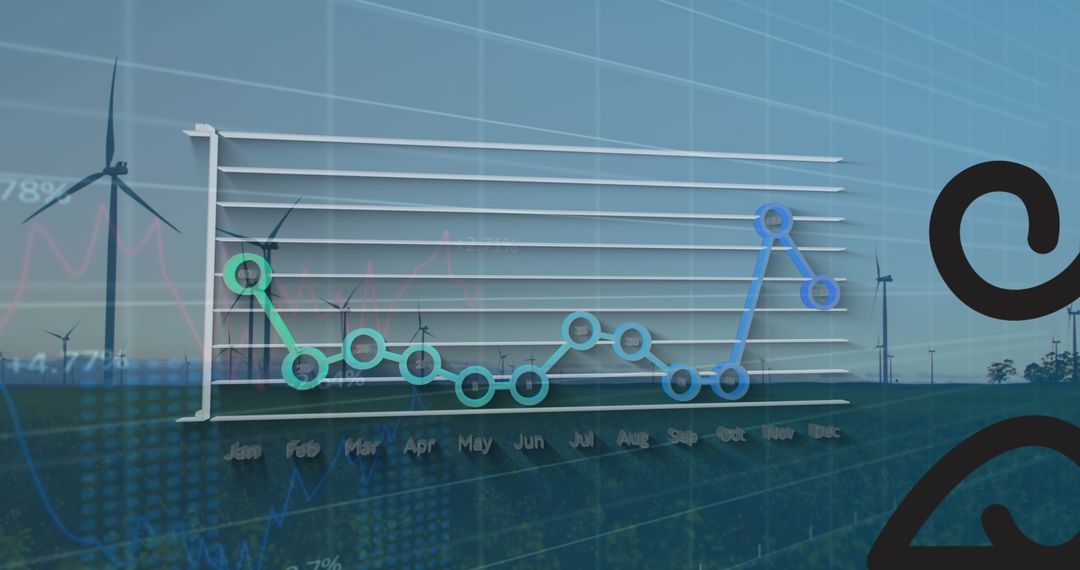
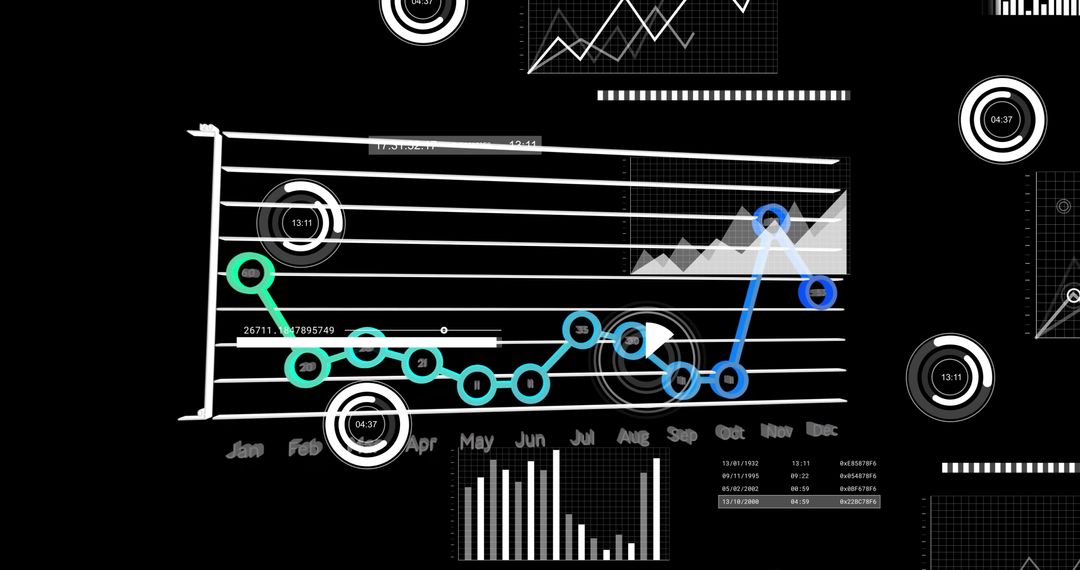
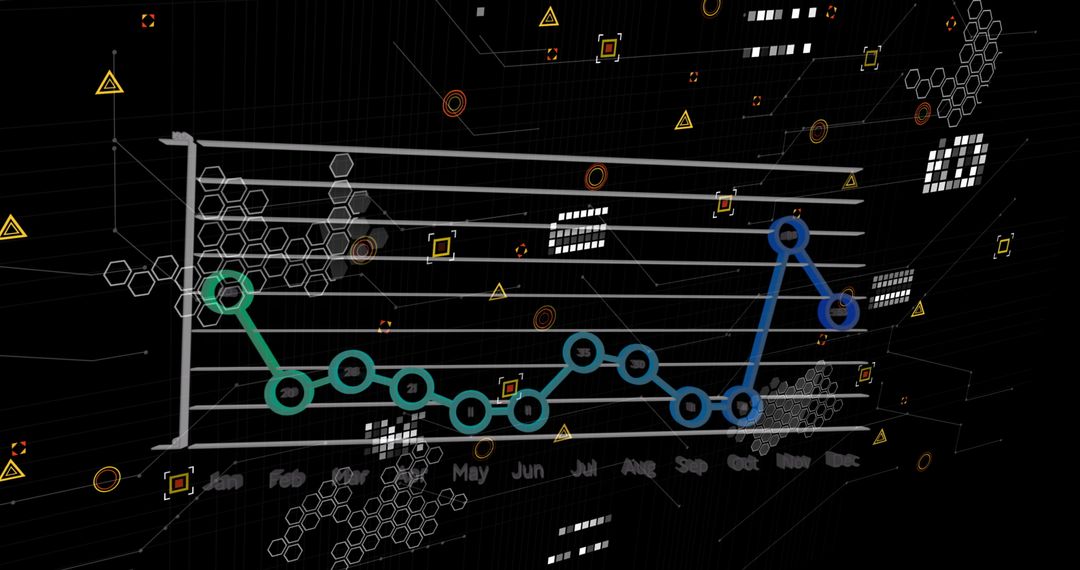
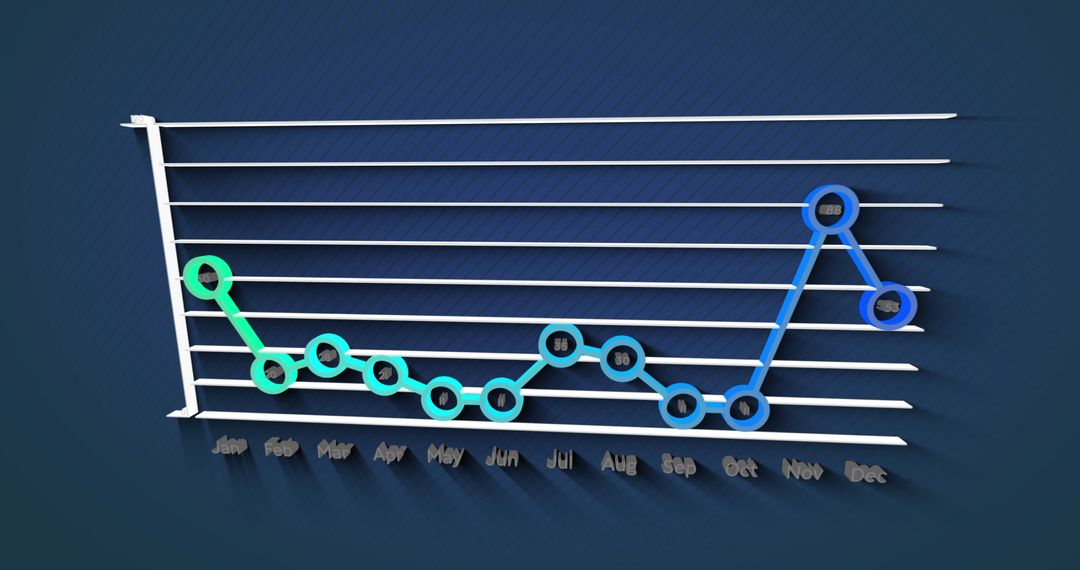
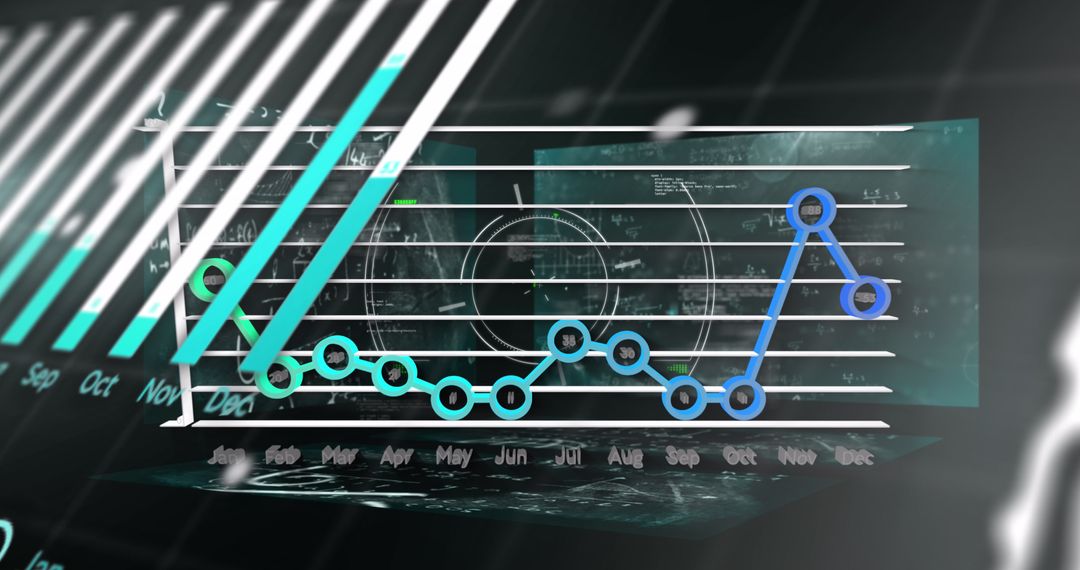
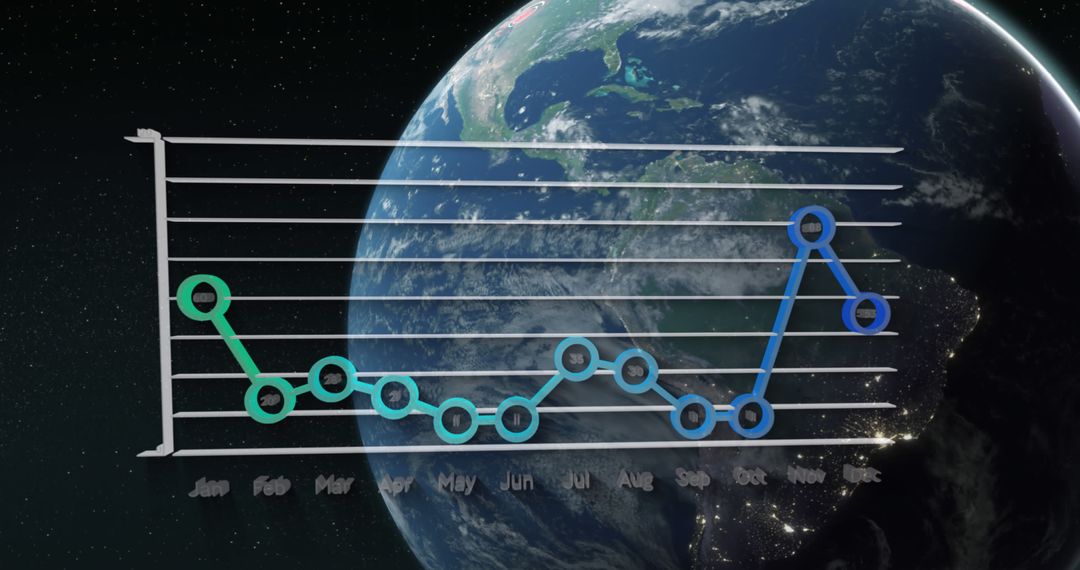
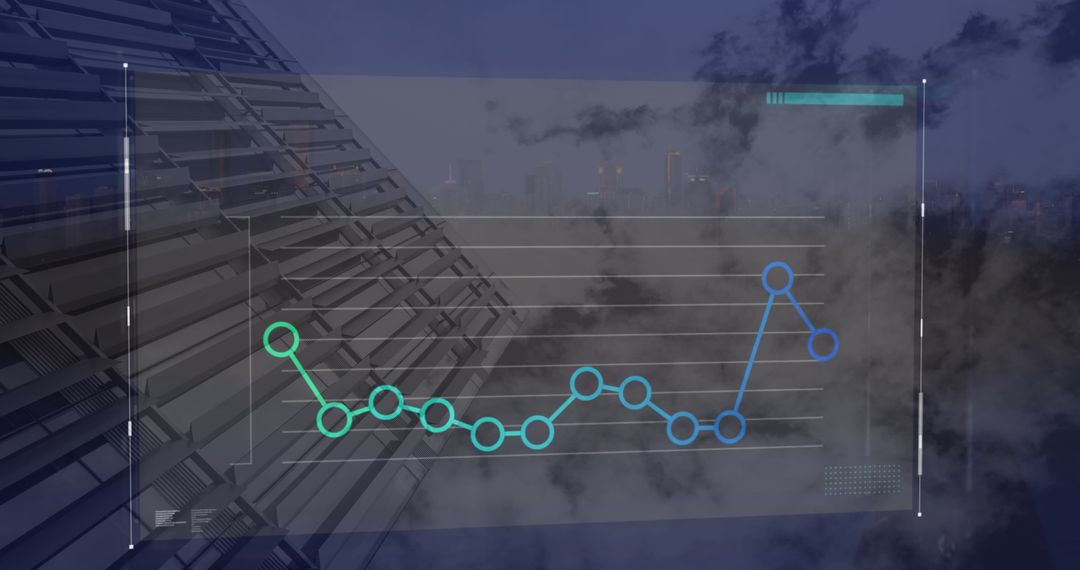
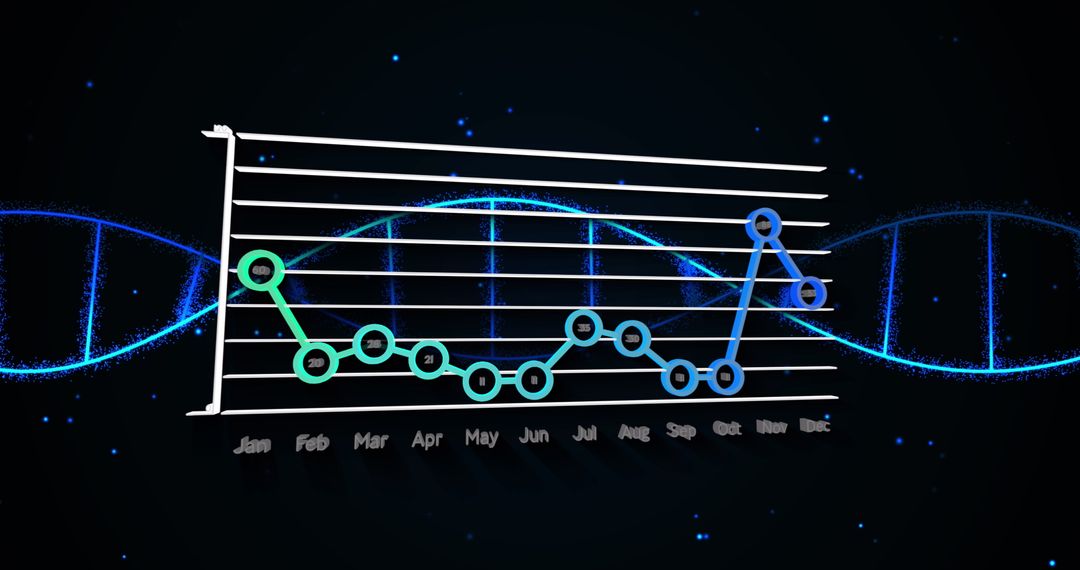
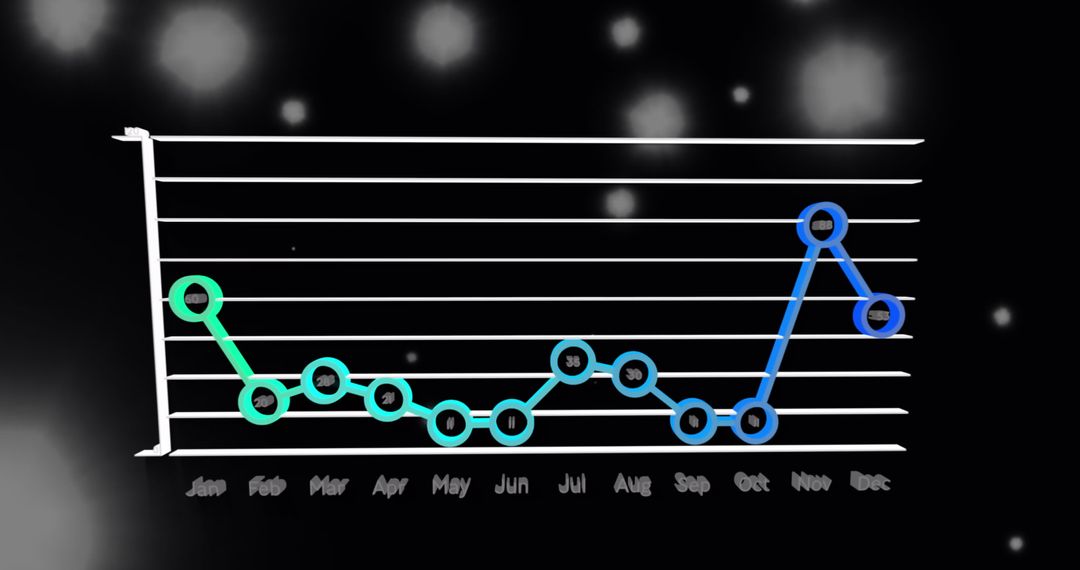
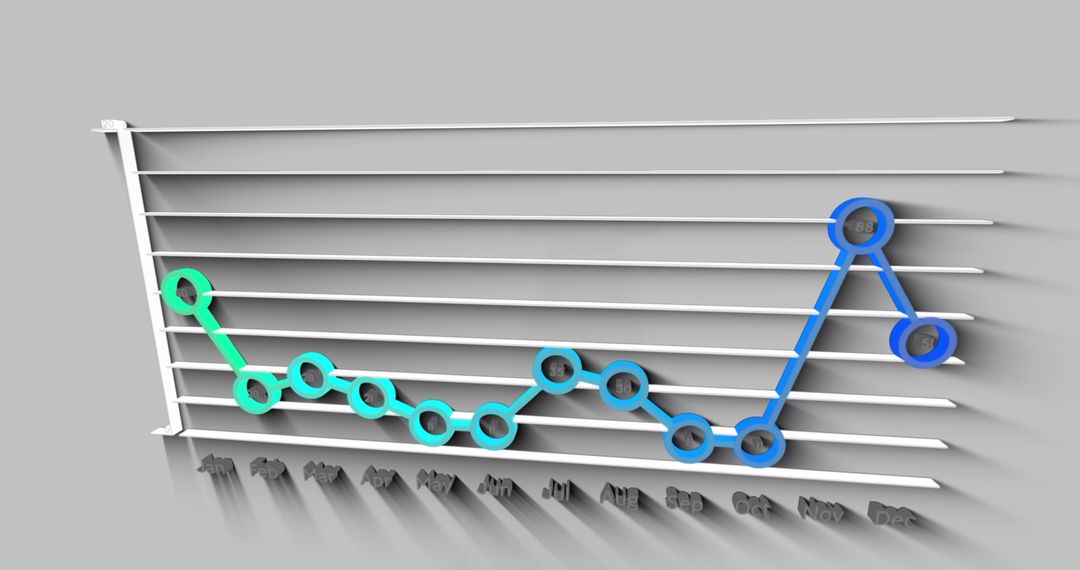
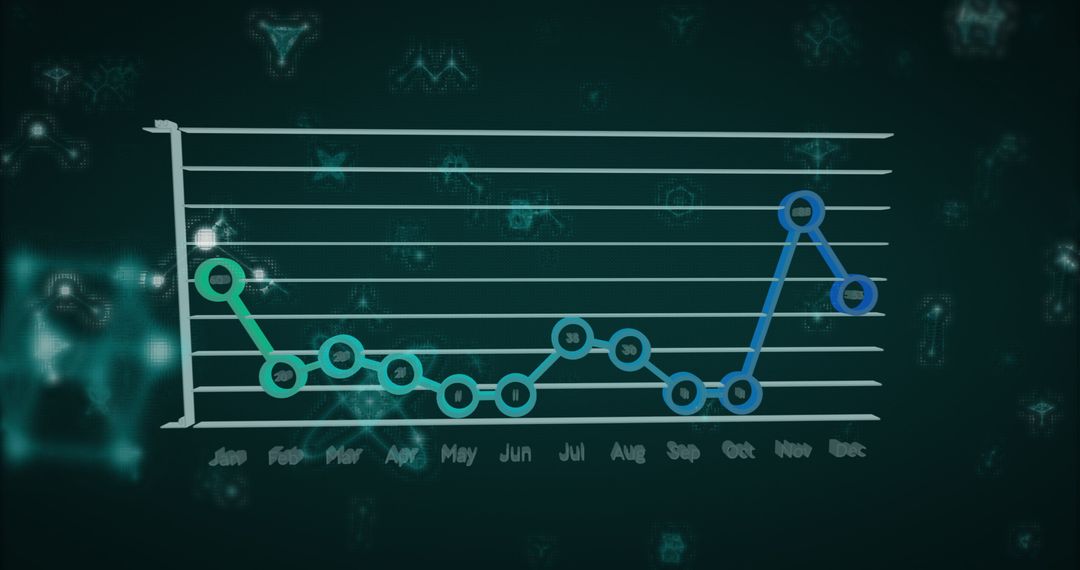
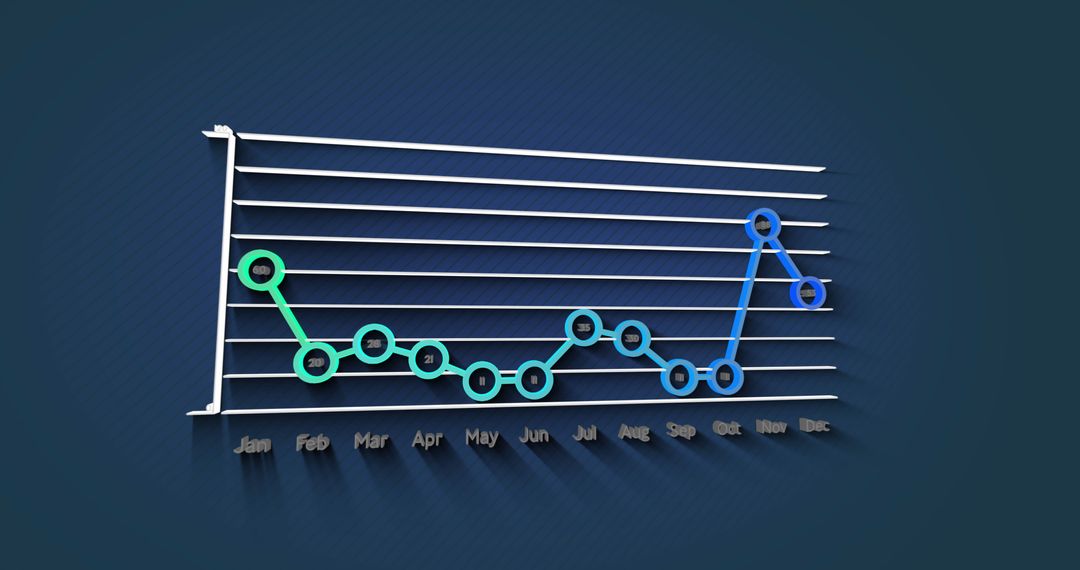
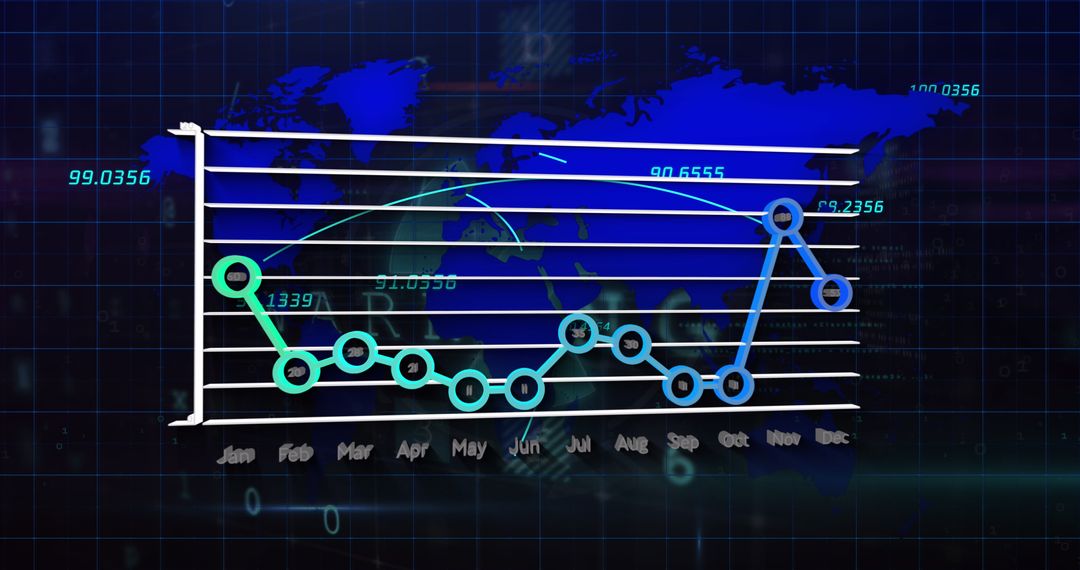
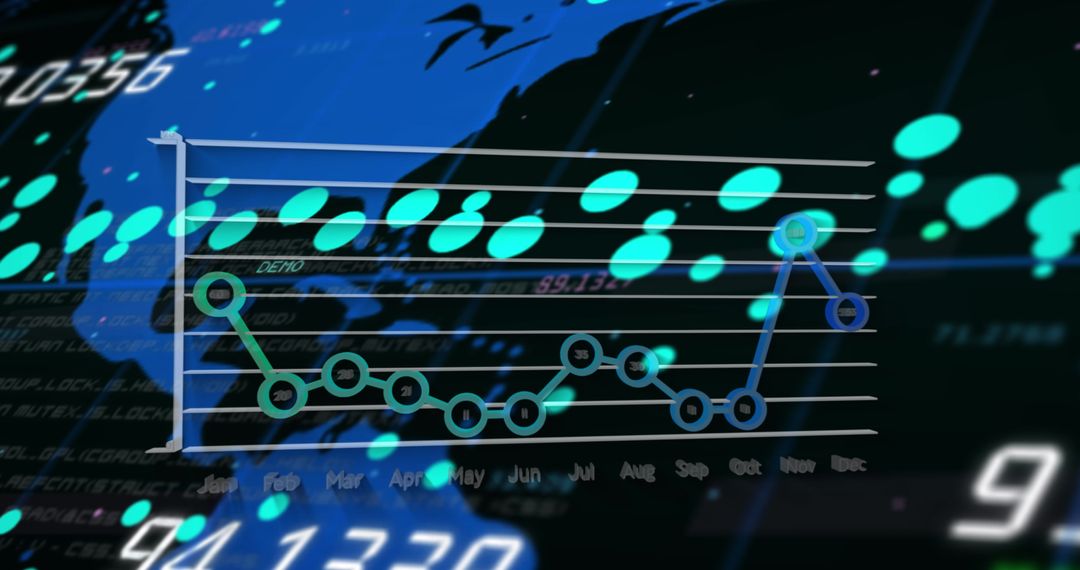
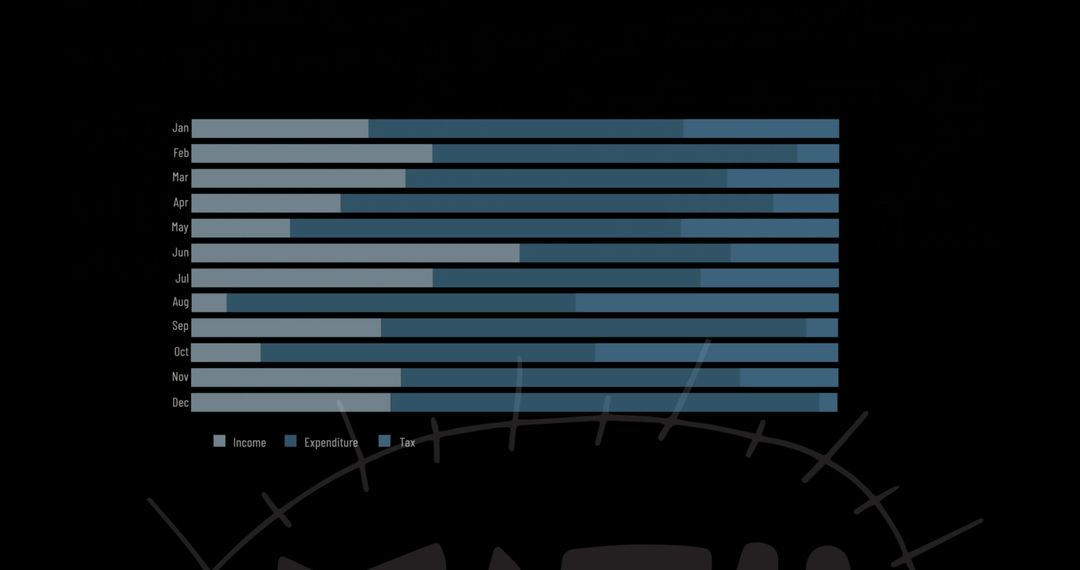
- Futuristic Neon Line Chart with Monthly Analytics Dashboard
Futuristic Neon Line Chart with Monthly Analytics Dashboard Image
This image features a stylized line chart with vibrant neon highlights, depicting monthly data trends in a digital format. Ideal for use in presentations focused on technology and data analysis, it can enhance visual appeal with its futuristic design. Great for branding materials or tech-themed content, drawing attention to reports and insights.
Powered by  - Get 15% off with code: PIKWIZARD15


2
downloads
downloads
Tags:
More
Credit Photo
If you would like to credit the Photo, here are some ways you can do so
Text Link
photo Link
<span class="text-link">
<span>
<a target="_blank" href=https://pikwizard.com/photo/futuristic-neon-line-chart-with-monthly-analytics-dashboard/f38efde6c301a0813986c3d60830d78a/>PikWizard</a>
</span>
</span>
<span class="image-link">
<span
style="margin: 0 0 20px 0; display: inline-block; vertical-align: middle; width: 100%;"
>
<a
target="_blank"
href="https://pikwizard.com/photo/futuristic-neon-line-chart-with-monthly-analytics-dashboard/f38efde6c301a0813986c3d60830d78a/"
style="text-decoration: none; font-size: 10px; margin: 0;"
>
<img src="https://pikwizard.com/pw/medium/f38efde6c301a0813986c3d60830d78a.jpg" style="margin: 0; width: 100%;" alt="" />
<p style="font-size: 12px; margin: 0;">PikWizard</p>
</a>
</span>
</span>
Free (free of charge)
Free for personal and commercial use.
Author: Awesome Content
Similar Free Stock Images

Premium


Premium


Premium


Premium


Premium


Premium


Premium


Premium


Premium


Premium


Premium


Premium


Premium


Premium


Premium


Premium


Premium


Premium


Premium


Premium


Premium


Premium


Premium


Premium