
- Home >
- Stock Photos >
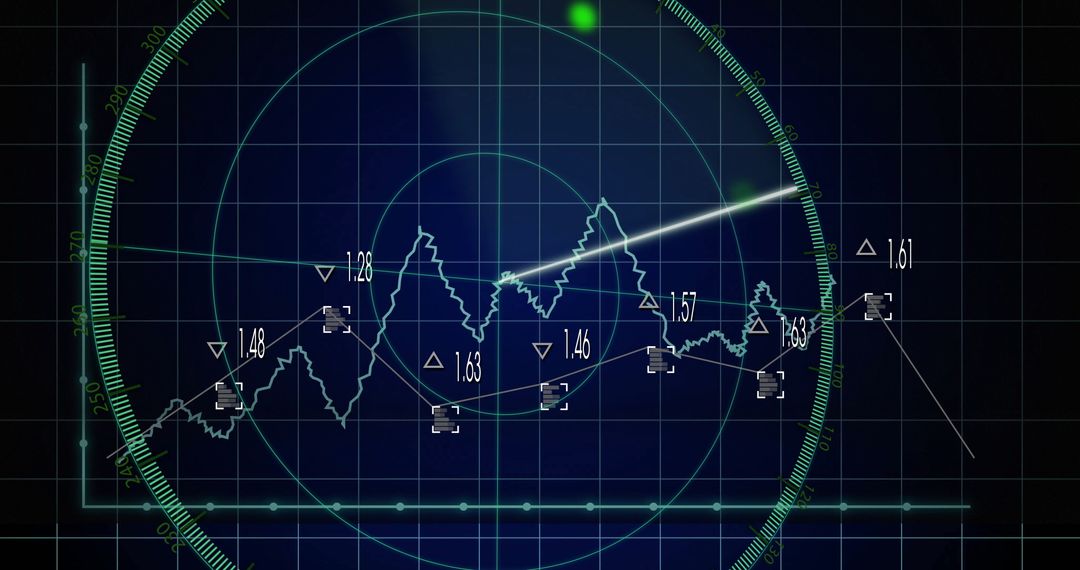
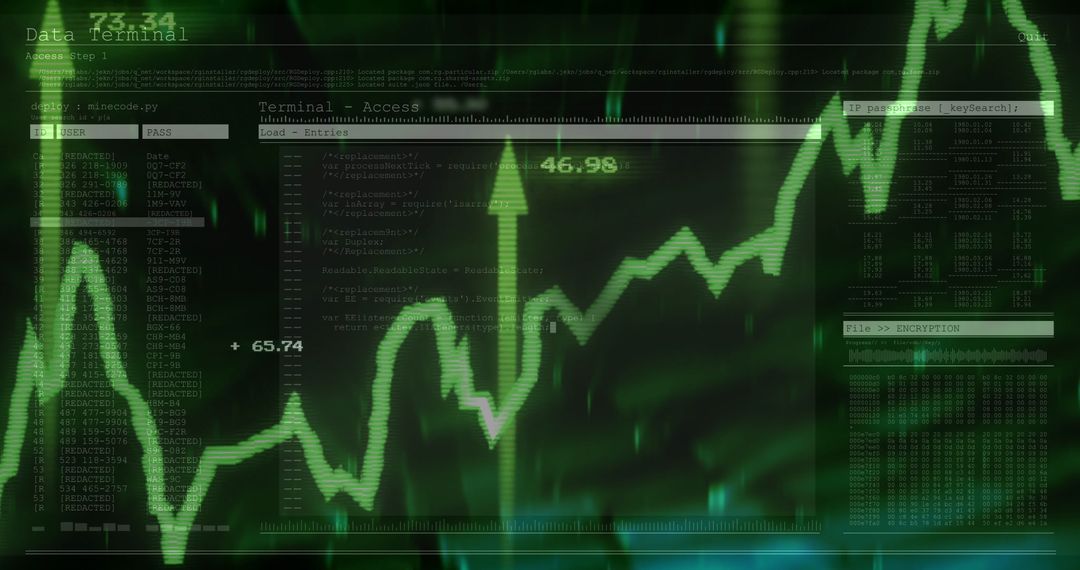
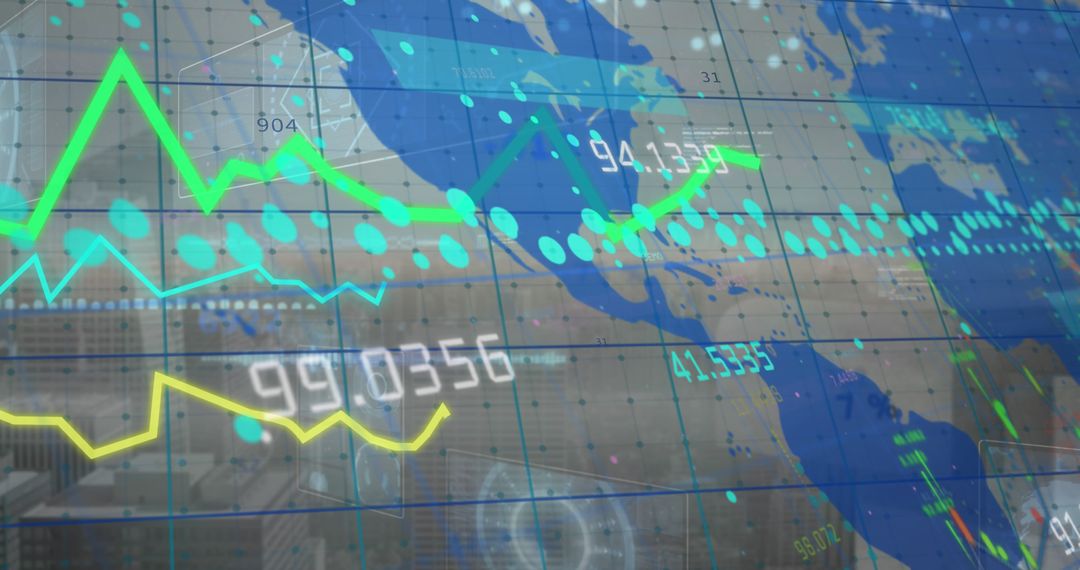
- Futuristic Neon Line Graph on Virtual Analytics Dashboard
Futuristic Neon Line Graph on Virtual Analytics Dashboard Image

Futuristic neon green line graph moving smoothly across a digital analytics dashboard, enhanced by a wireframe globe in the background, conveys technological advancements. Useful for illustrating themes in financial technology, data analytics, or digital innovation. Suitable for presentations, marketing materials, or editorial use depicting cutting-edge scientific or economic research.
Powered by 


0
downloads
downloads
Tags:
More
Credit Photo
If you would like to credit the Photo, here are some ways you can do so
Text Link
photo Link
<span class="text-link">
<span>
<a target="_blank" href=https://pikwizard.com/photo/futuristic-neon-line-graph-on-virtual-analytics-dashboard/8a9b056739a3e03ca33d843fe6045915/>PikWizard</a>
</span>
</span>
<span class="image-link">
<span
style="margin: 0 0 20px 0; display: inline-block; vertical-align: middle; width: 100%;"
>
<a
target="_blank"
href="https://pikwizard.com/photo/futuristic-neon-line-graph-on-virtual-analytics-dashboard/8a9b056739a3e03ca33d843fe6045915/"
style="text-decoration: none; font-size: 10px; margin: 0;"
>
<img src="https://pikwizard.com/pw/medium/8a9b056739a3e03ca33d843fe6045915.jpg" style="margin: 0; width: 100%;" alt="" />
<p style="font-size: 12px; margin: 0;">PikWizard</p>
</a>
</span>
</span>
Free (free of charge)
Free for personal and commercial use.
Author: Authentic Images
Similar Free Stock Images

Premium


Premium


Premium


Premium


Premium


Premium


Premium


Premium


Premium


Premium


Premium


Premium


Premium


Premium


Premium


Premium


Premium


Premium


Premium


Premium


Premium


Premium


Premium


Premium

