
- Home >
- Stock Photos >
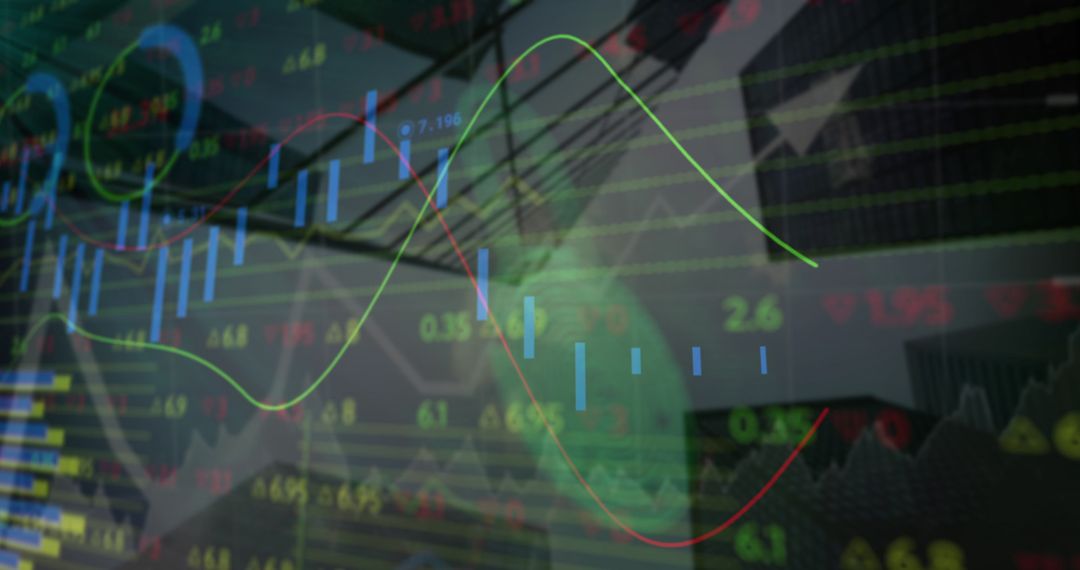
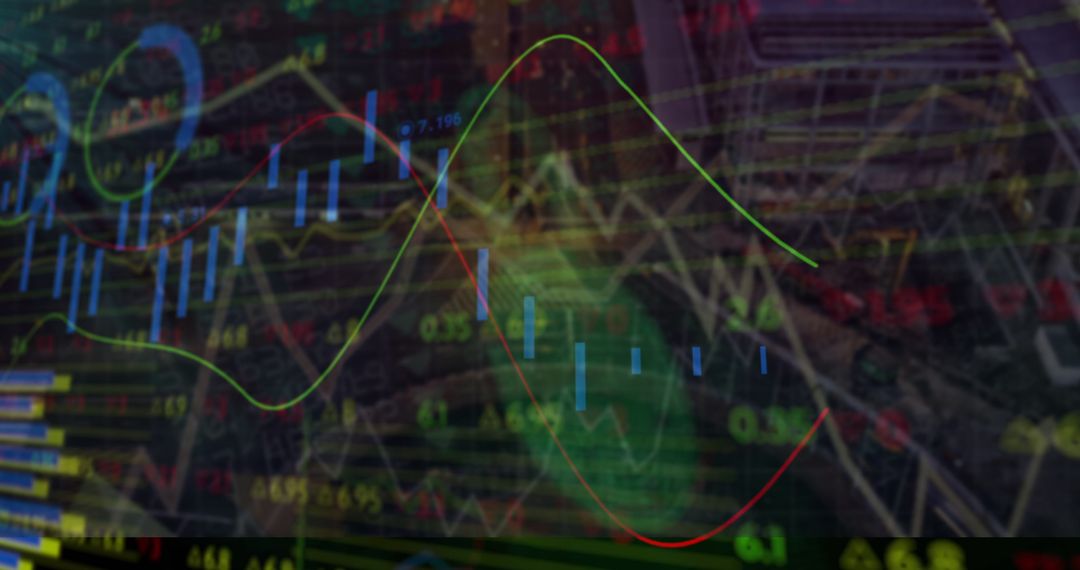
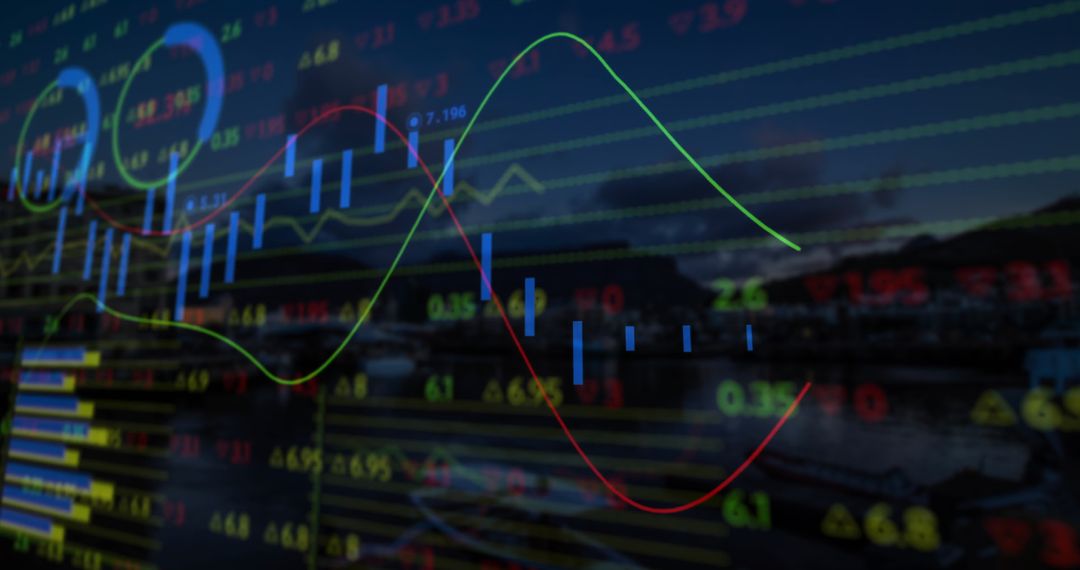
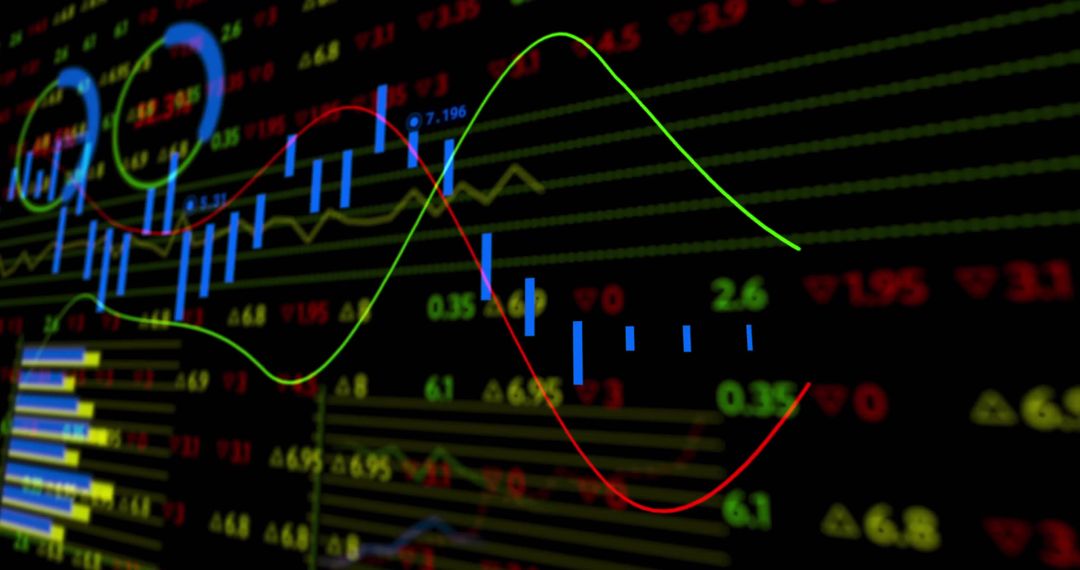
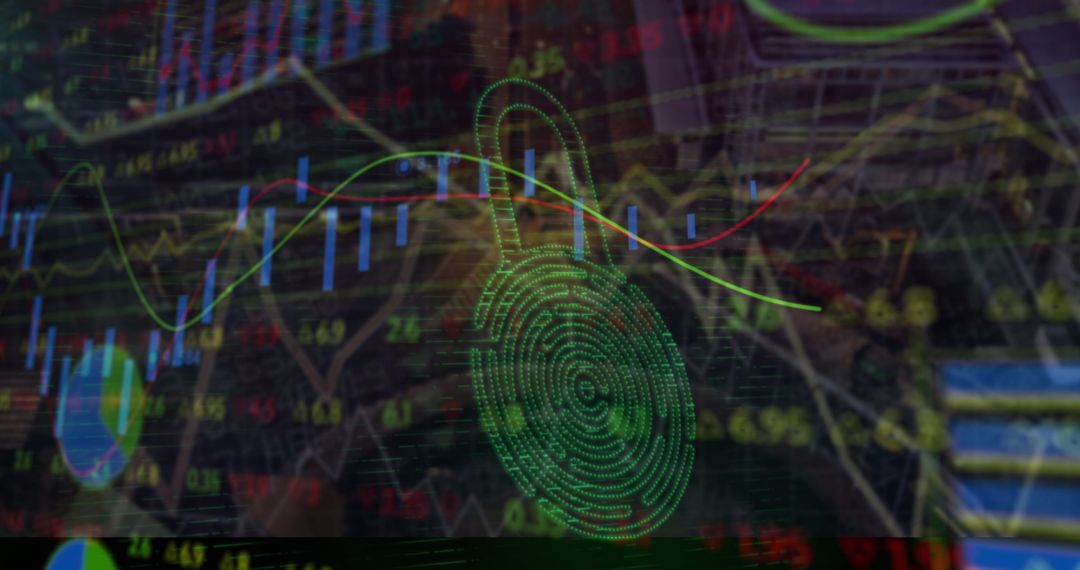
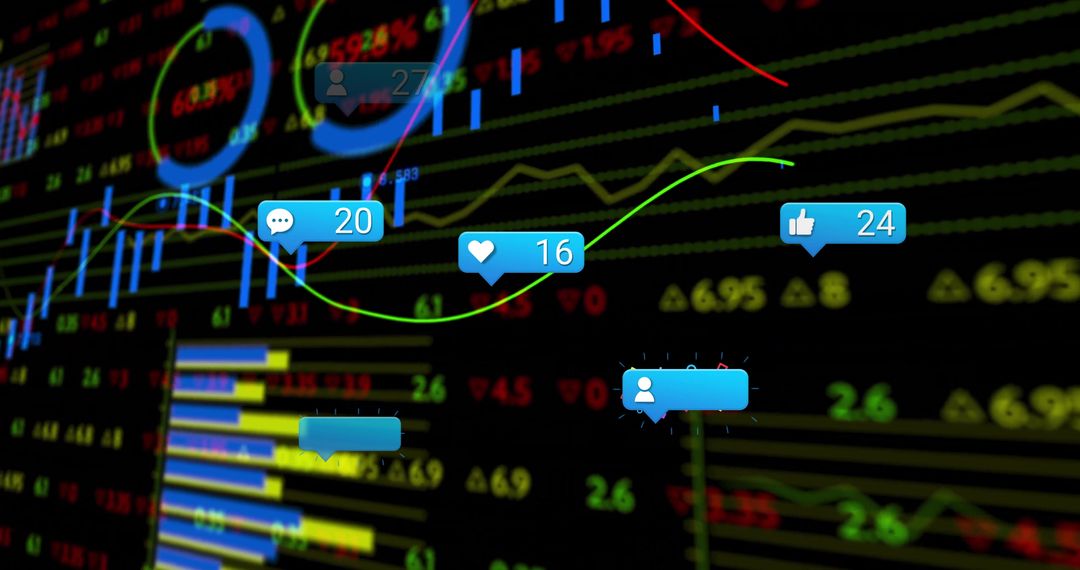
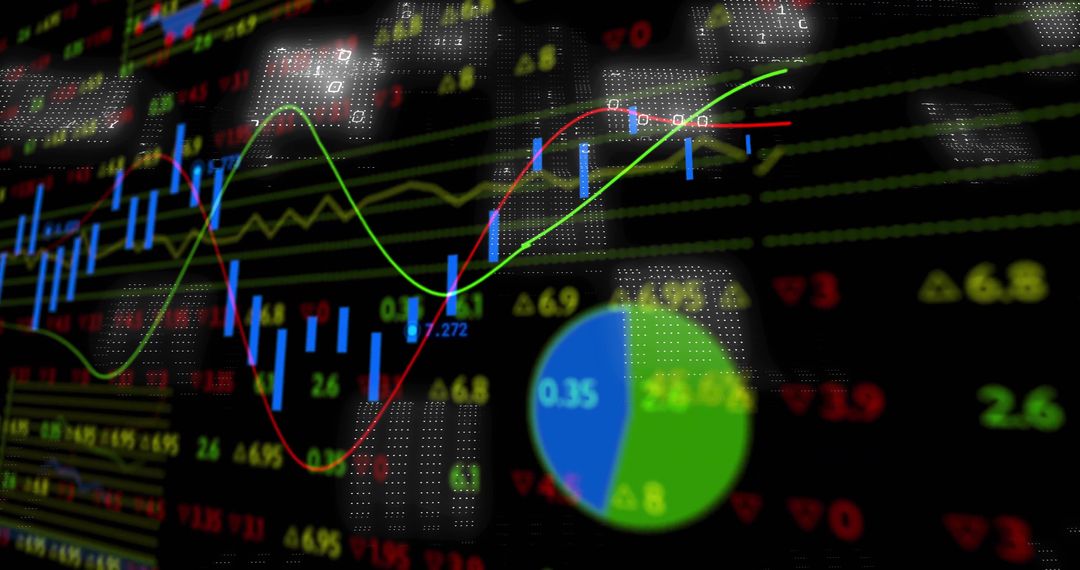
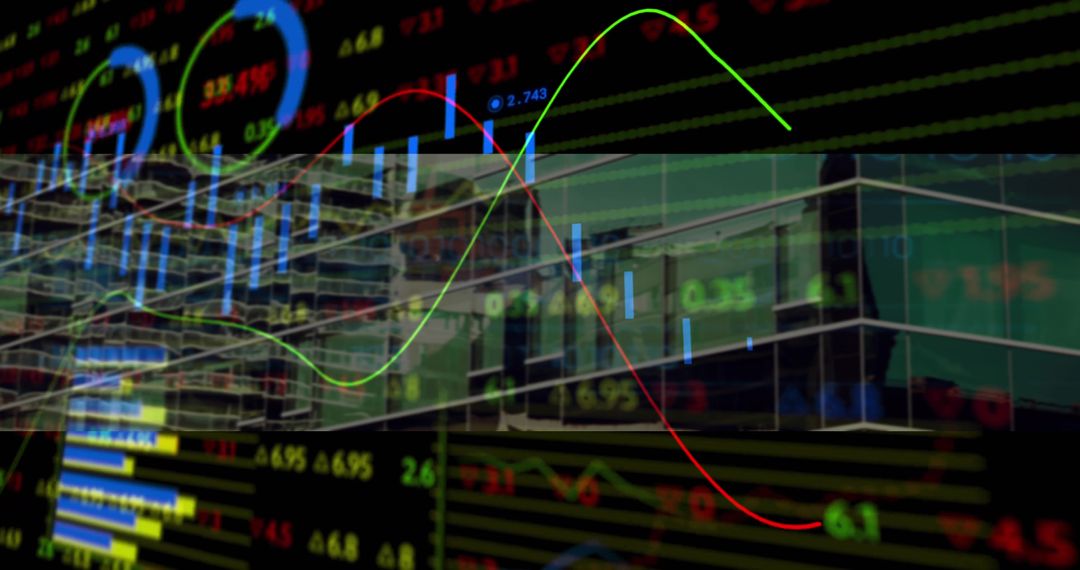
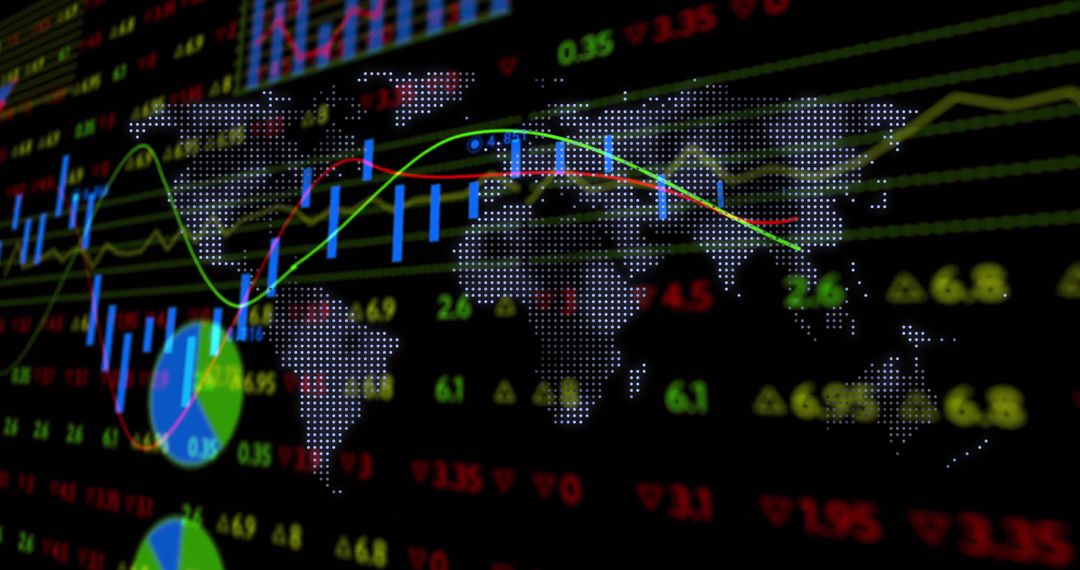
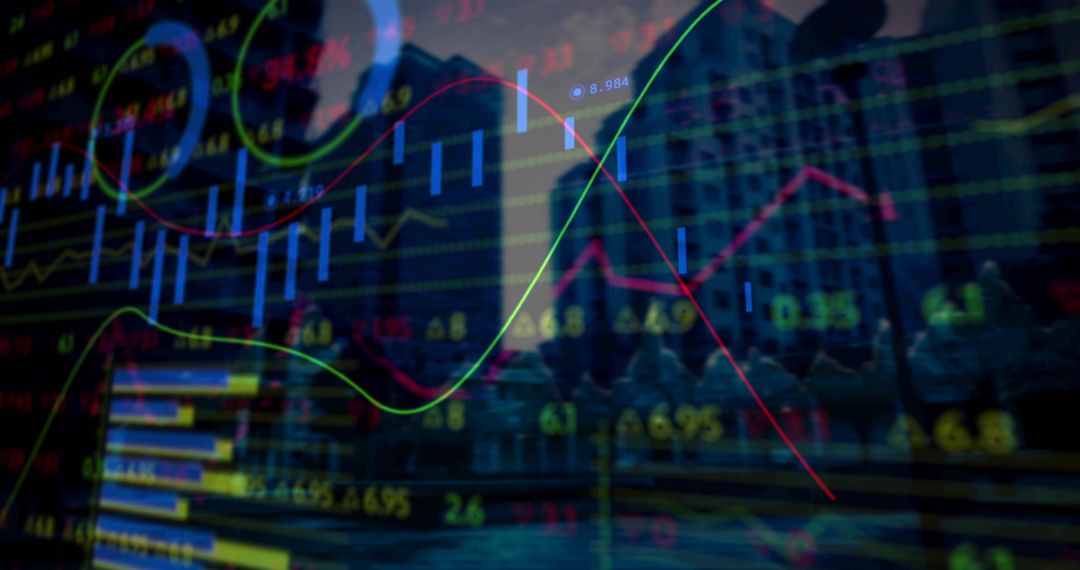
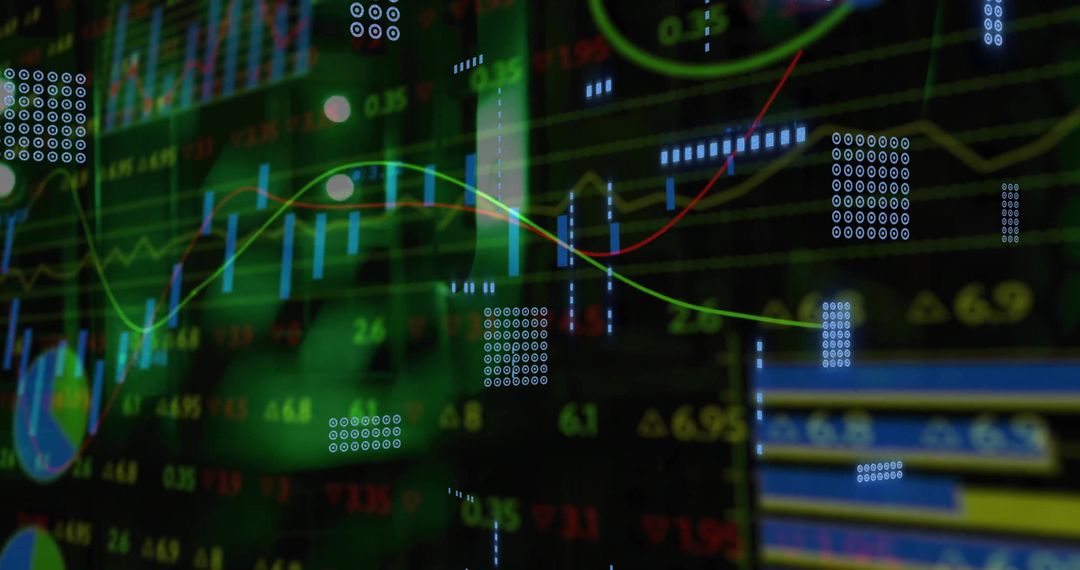
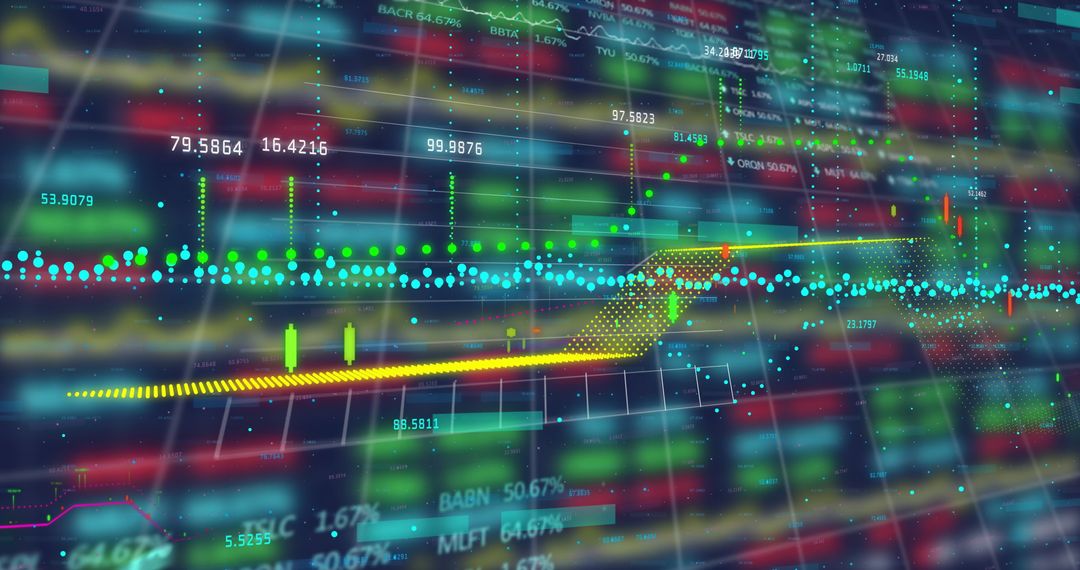
- Futuristic Neon Trading Dashboard Visualizing Candlestick, Line Charts and Network Analytics
Futuristic Neon Trading Dashboard Visualizing Candlestick, Line Charts and Network Analytics Image
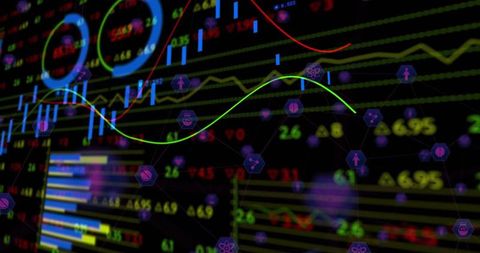
Dark high-contrast trading interface showing glowing blue candlesticks, neon green and red trend lines, circular gauges, and hexagonal network icons overlaying scrolling numerical tickers. Foreground elements are sharp while background data is blurred, creating depth and futuristic mood. Graphic is highlighting real-time analytics, multi-layered data streams, and connected metric nodes suitable for conveying complex market signals. Use for fintech branding, trading platform landing pages, financial reports, investor presentations, market analysis articles, app UI concepts, technology blog headers, and digital advertising. Composition supports overlaying headlines, logos, and UI mockups for hero banners, slide decks, or product demos focused on algorithmic trading, data science, or business intelligence.
Powered by  - Get 15% off with code: PIKWIZARD15


0
downloads
downloads
Tags:
More
Credit Photo
If you would like to credit the Photo, here are some ways you can do so
Text Link
photo Link
<span class="text-link">
<span>
<a target="_blank" href=https://pikwizard.com/photo/futuristic-neon-trading-dashboard-visualizing-candlestick-line-charts-and-network-analytics/7e366b0da1df40f9bd636ce4529bbba8/>PikWizard</a>
</span>
</span>
<span class="image-link">
<span
style="margin: 0 0 20px 0; display: inline-block; vertical-align: middle; width: 100%;"
>
<a
target="_blank"
href="https://pikwizard.com/photo/futuristic-neon-trading-dashboard-visualizing-candlestick-line-charts-and-network-analytics/7e366b0da1df40f9bd636ce4529bbba8/"
style="text-decoration: none; font-size: 10px; margin: 0;"
>
<img src="https://pikwizard.com/pw/medium/7e366b0da1df40f9bd636ce4529bbba8.jpg" style="margin: 0; width: 100%;" alt="" />
<p style="font-size: 12px; margin: 0;">PikWizard</p>
</a>
</span>
</span>
Free (free of charge)
Free for personal and commercial use.
Author: Awesome Content
Similar Free Stock Images
Premium


Premium


Premium


Premium


Premium


Premium


Premium


Premium


Premium


Premium


Premium


Premium


Premium

Premium


Premium


Premium


Premium

Premium


Premium


Premium


Premium


Premium


Premium


Premium

